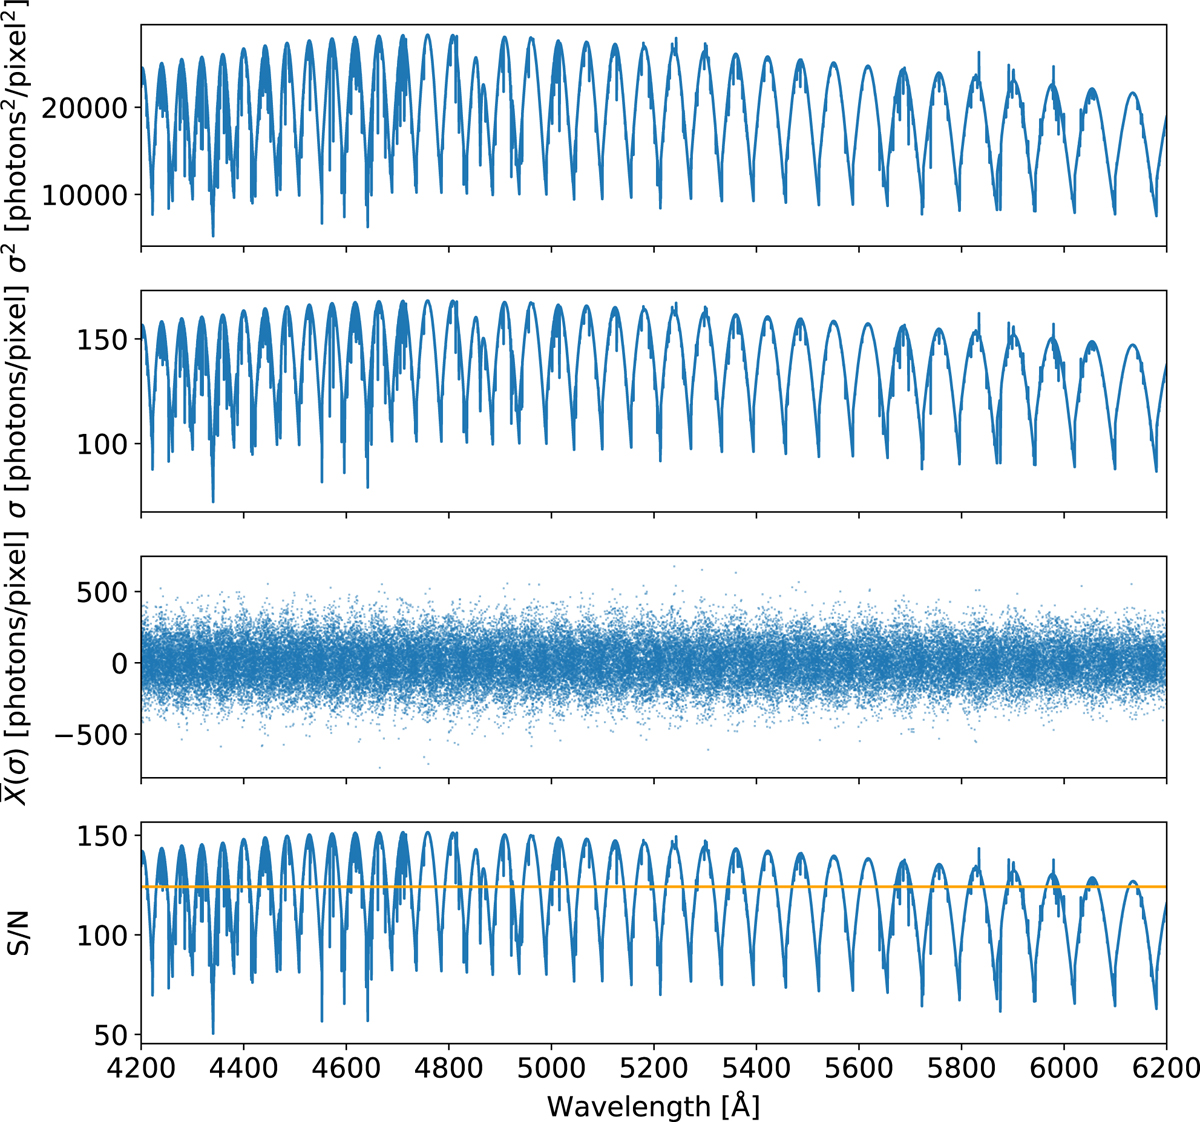
Fig. A.2
Download original image
Noise and S/N distributions obtained with Vmag = 4 and texp = 15 min. Top panel: Variance (σ2) of the 1D simulated flux obtained by summing the different noise contributions in quadrature according to Eq. 7. Second panel: Standard deviation (σ) of the 1D simulated flux. Third panel: Noise spectrum obtained by setting its standard deviation as computed in the previous panel. Fourth panel: Synthetic S/N spectrum over the complete spectral range of CubeSPEC, obtained by dividing the 1D signal by its standard deviation. The horizontal orange line shows the median S/N.
Current usage metrics show cumulative count of Article Views (full-text article views including HTML views, PDF and ePub downloads, according to the available data) and Abstracts Views on Vision4Press platform.
Data correspond to usage on the plateform after 2015. The current usage metrics is available 48-96 hours after online publication and is updated daily on week days.
Initial download of the metrics may take a while.