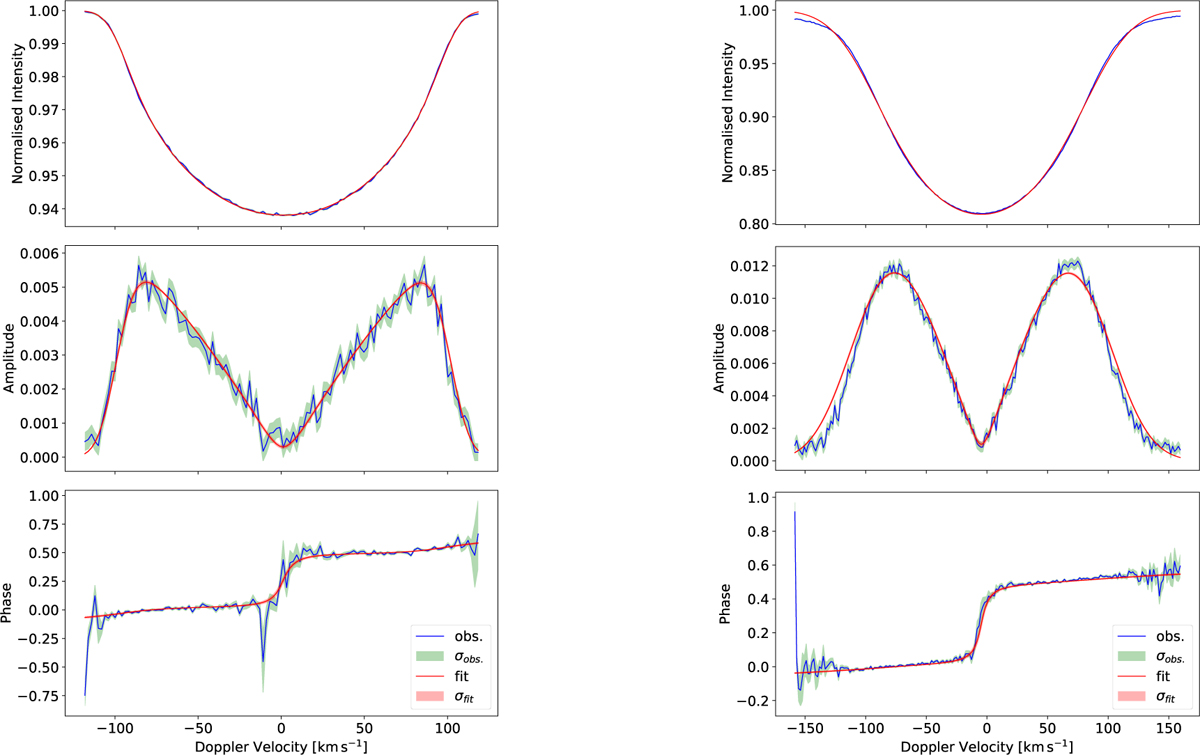
Fig. B.1
Download original image
Best fit for Si III λ4553 (left) and He I λ5876 (right) lines resulting from mode identification with the FPF method for a single radial mode configuration with i = 60°, υe sin i = 100 km s−1, f = 5.25 d−1, and υamp = 21 kms−1 as inputs. The FPF method fits a model (red line) to the observational (blue line) zero-point (top panel), amplitude (middle panel), and phase (bottom panel) profiles for each detected pulsation frequency mode. The statistical uncertainty range of the observations and the model are shown by the red and green shaded areas, respectively.
Current usage metrics show cumulative count of Article Views (full-text article views including HTML views, PDF and ePub downloads, according to the available data) and Abstracts Views on Vision4Press platform.
Data correspond to usage on the plateform after 2015. The current usage metrics is available 48-96 hours after online publication and is updated daily on week days.
Initial download of the metrics may take a while.