Fig. 5
Download original image
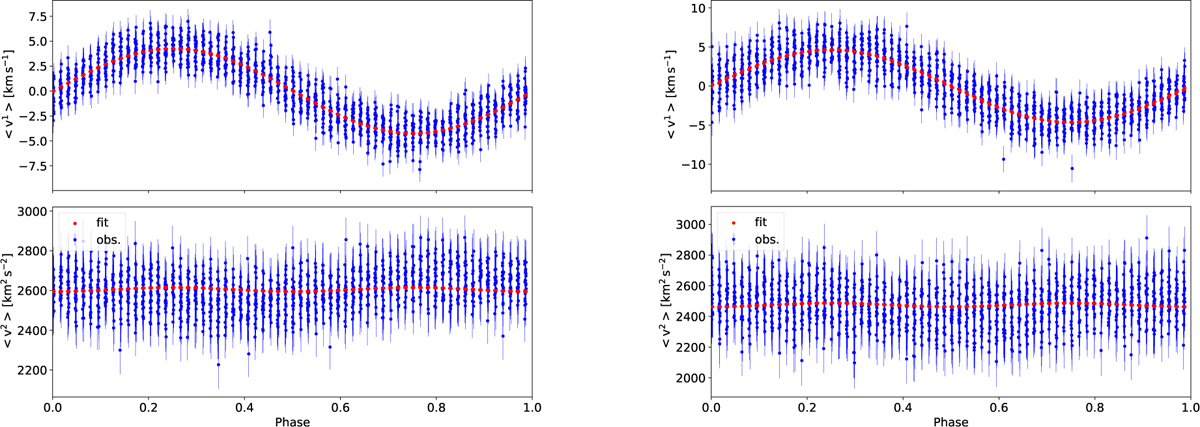
Best fit for Si III λ4567 (left) and λ4574 (right) lines from mode identification with the MM for the SC1 RADIAL scenario with i = 60°, υe sin i = 100 km s−1, f = 5.25 d−1, and υamp = 21 km s−1 as inputs. The data are phase-folded according to the detected frequency. The observational data along with their error bars are shown in blue and the fit in red for the first (top) and second (bottom) moments of the time series.
Current usage metrics show cumulative count of Article Views (full-text article views including HTML views, PDF and ePub downloads, according to the available data) and Abstracts Views on Vision4Press platform.
Data correspond to usage on the plateform after 2015. The current usage metrics is available 48-96 hours after online publication and is updated daily on week days.
Initial download of the metrics may take a while.