Fig. 3.
Download original image
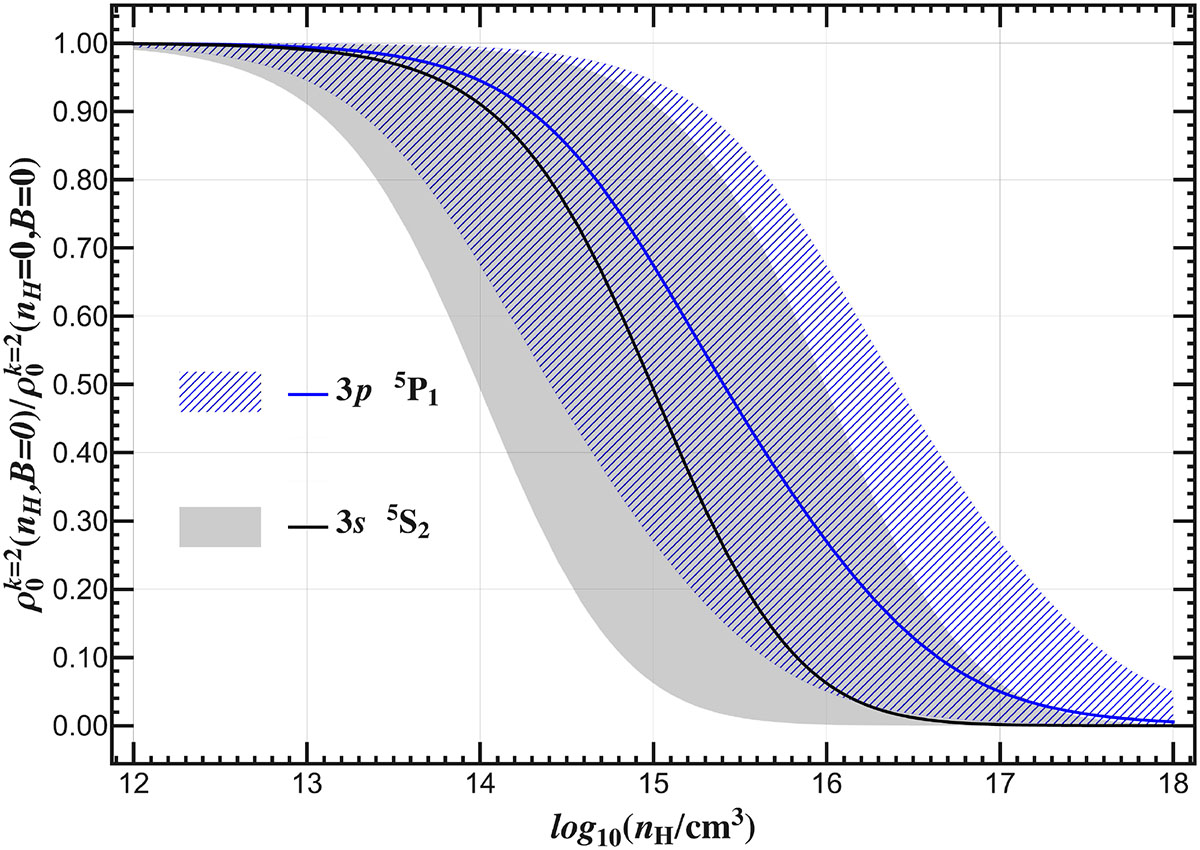
Sensitivity of the normalized alignment, ![]() , to uncertainties in the elastic O–H collisional operator D as a function of log10(nH/cm3). For each level, the solid curve is the reference calculation (D), while the shaded band spans the range obtained by uniformly scaling all elastic rates to D/10 and 10 × D. The gray band and black line refer to the S2 level (3s5S, J = 2), and the blue band and line to the P1 level (3p3P, J = 1) shown in Fig. 2. Results are for B = 0.
, to uncertainties in the elastic O–H collisional operator D as a function of log10(nH/cm3). For each level, the solid curve is the reference calculation (D), while the shaded band spans the range obtained by uniformly scaling all elastic rates to D/10 and 10 × D. The gray band and black line refer to the S2 level (3s5S, J = 2), and the blue band and line to the P1 level (3p3P, J = 1) shown in Fig. 2. Results are for B = 0.
Current usage metrics show cumulative count of Article Views (full-text article views including HTML views, PDF and ePub downloads, according to the available data) and Abstracts Views on Vision4Press platform.
Data correspond to usage on the plateform after 2015. The current usage metrics is available 48-96 hours after online publication and is updated daily on week days.
Initial download of the metrics may take a while.