Open Access
Fig. 11.
Download original image
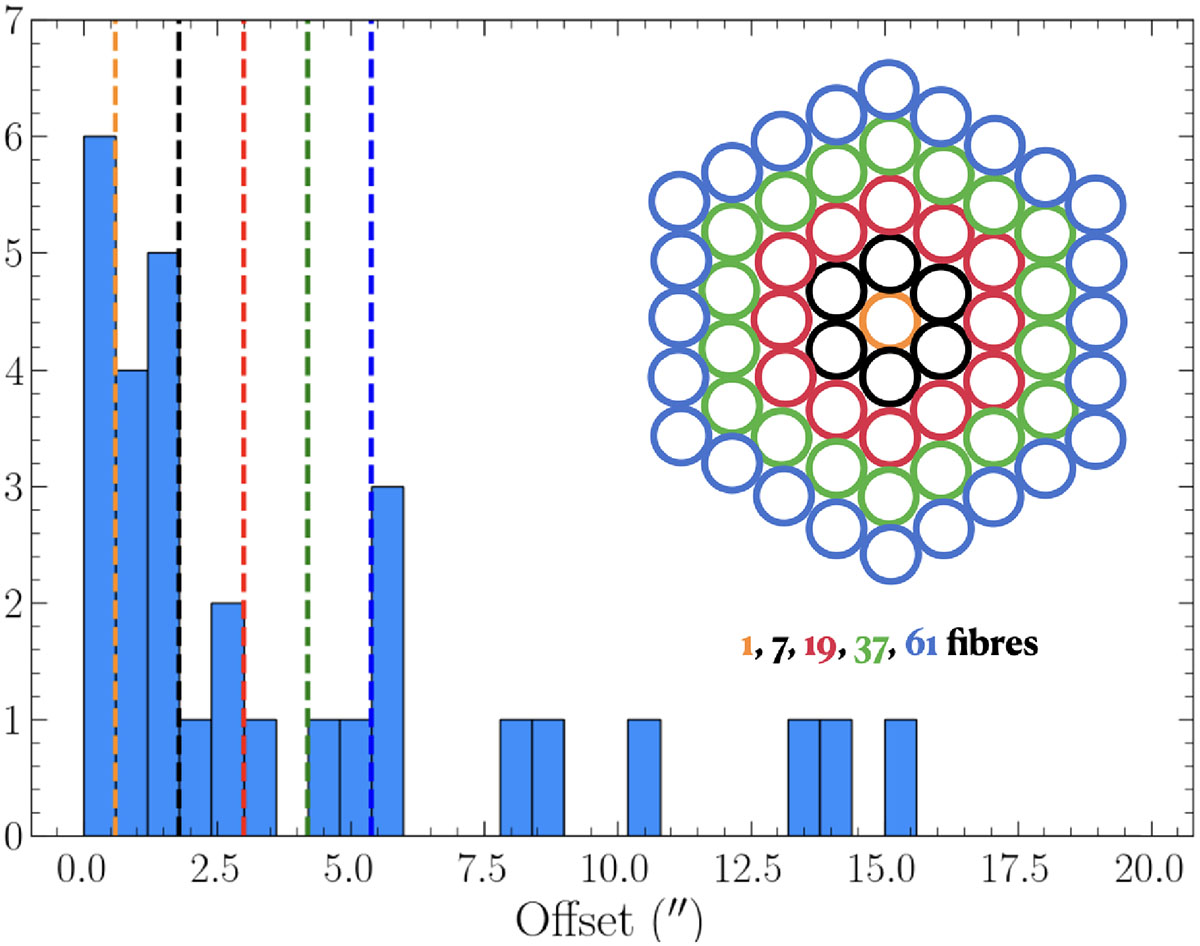
Distribution of the offsets of SGRBs at z < 0.5 from the sample presented in Fong et al. (2022). The dashed colored lines represent the angular size that could potentially be covered by an example fibre bundle configuration, as shown in the sketch in the upper right corner.
Current usage metrics show cumulative count of Article Views (full-text article views including HTML views, PDF and ePub downloads, according to the available data) and Abstracts Views on Vision4Press platform.
Data correspond to usage on the plateform after 2015. The current usage metrics is available 48-96 hours after online publication and is updated daily on week days.
Initial download of the metrics may take a while.