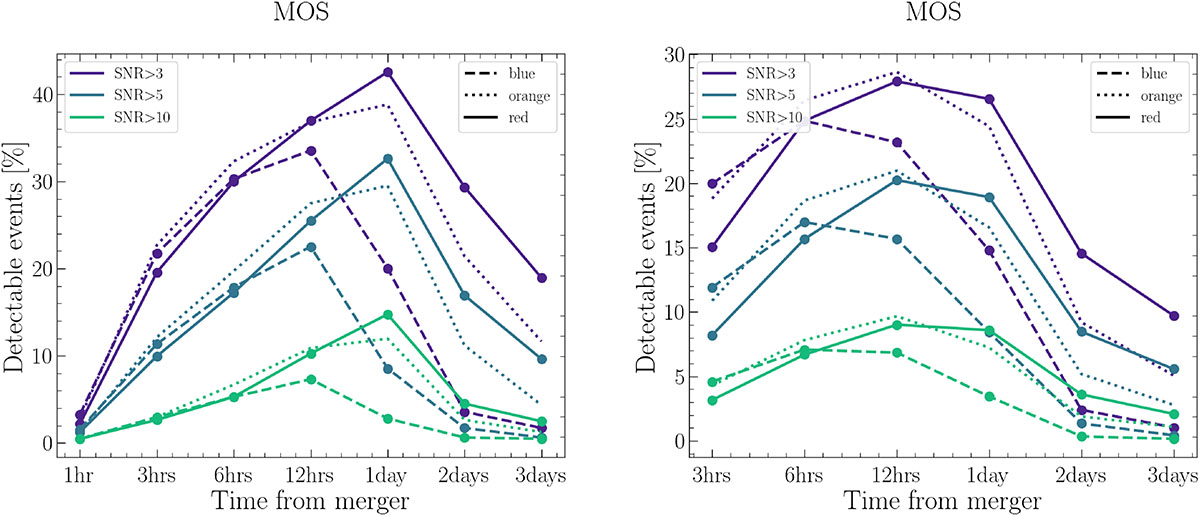
Fig. 2.
Download original image
Percentage of gfo-like KNe (left) and theoretical KNe (right) following BNS mergers detected by ET in the 2L configuration that are detectable with WST MOS. Different colors indicate different S/Ns; dashed, dotted, and solid lines correspond to the blue, orange, and red arms of the spectrographs, respectively. The highest detectability occurs approximately 12–24 hours post-merger. The peak time of the detectability reflects the optimal observational window across the full range of ejecta masses, compositions, and inclinations considered in our simulations.
Current usage metrics show cumulative count of Article Views (full-text article views including HTML views, PDF and ePub downloads, according to the available data) and Abstracts Views on Vision4Press platform.
Data correspond to usage on the plateform after 2015. The current usage metrics is available 48-96 hours after online publication and is updated daily on week days.
Initial download of the metrics may take a while.