Fig. C.10.
Download original image
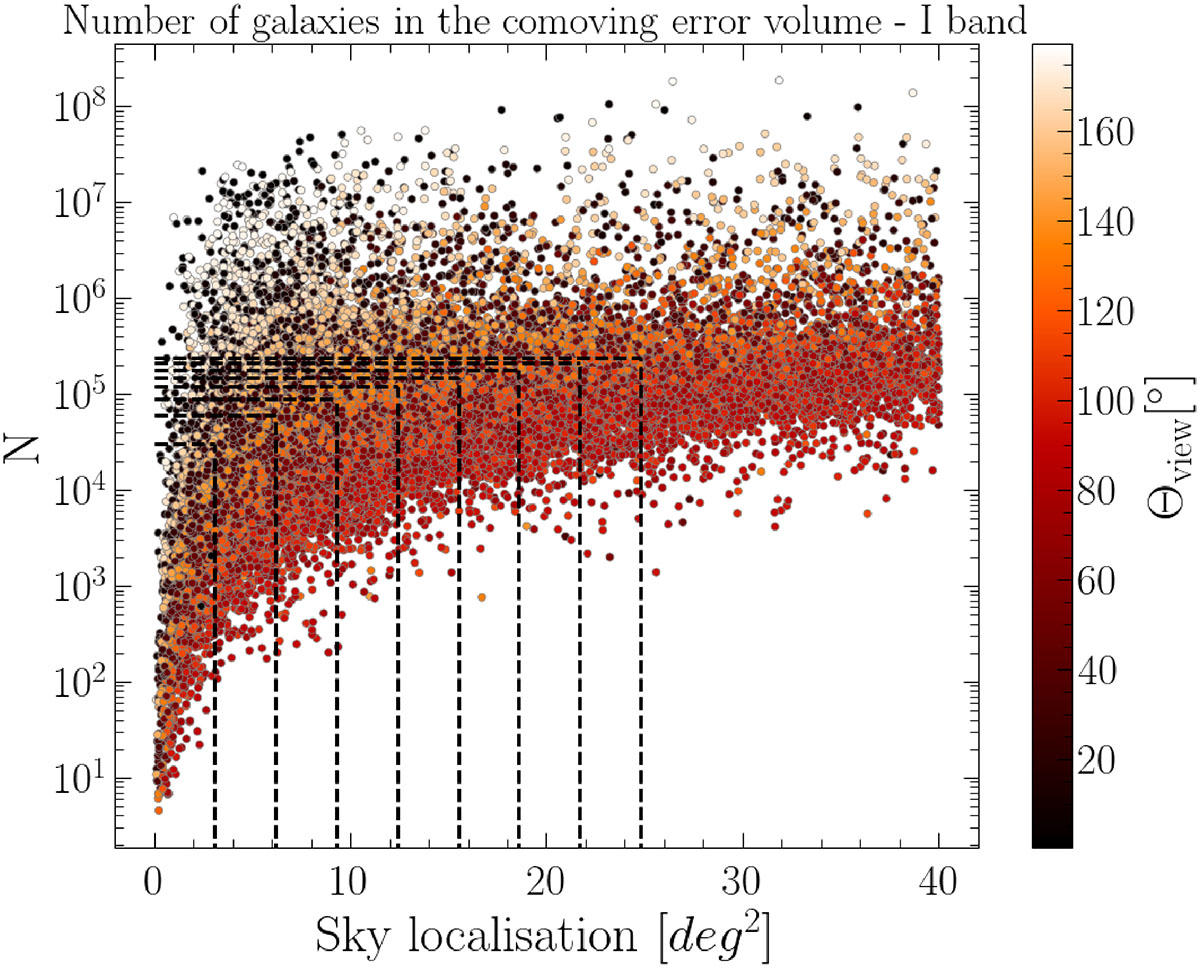
Number of galaxies in the comoving error volume of BNS at z < 0.45 detected by ET in a network with CE, as a function of their sky localisation. Vertical dashed lines represent the sky area covered for increasing number of exposures. Horizontal dashed lines refer to the corresponding number of WST fibers available within the FoV considered. The color bar refers to the viewing angle Θview.
Current usage metrics show cumulative count of Article Views (full-text article views including HTML views, PDF and ePub downloads, according to the available data) and Abstracts Views on Vision4Press platform.
Data correspond to usage on the plateform after 2015. The current usage metrics is available 48-96 hours after online publication and is updated daily on week days.
Initial download of the metrics may take a while.