Fig. 4.
Download original image
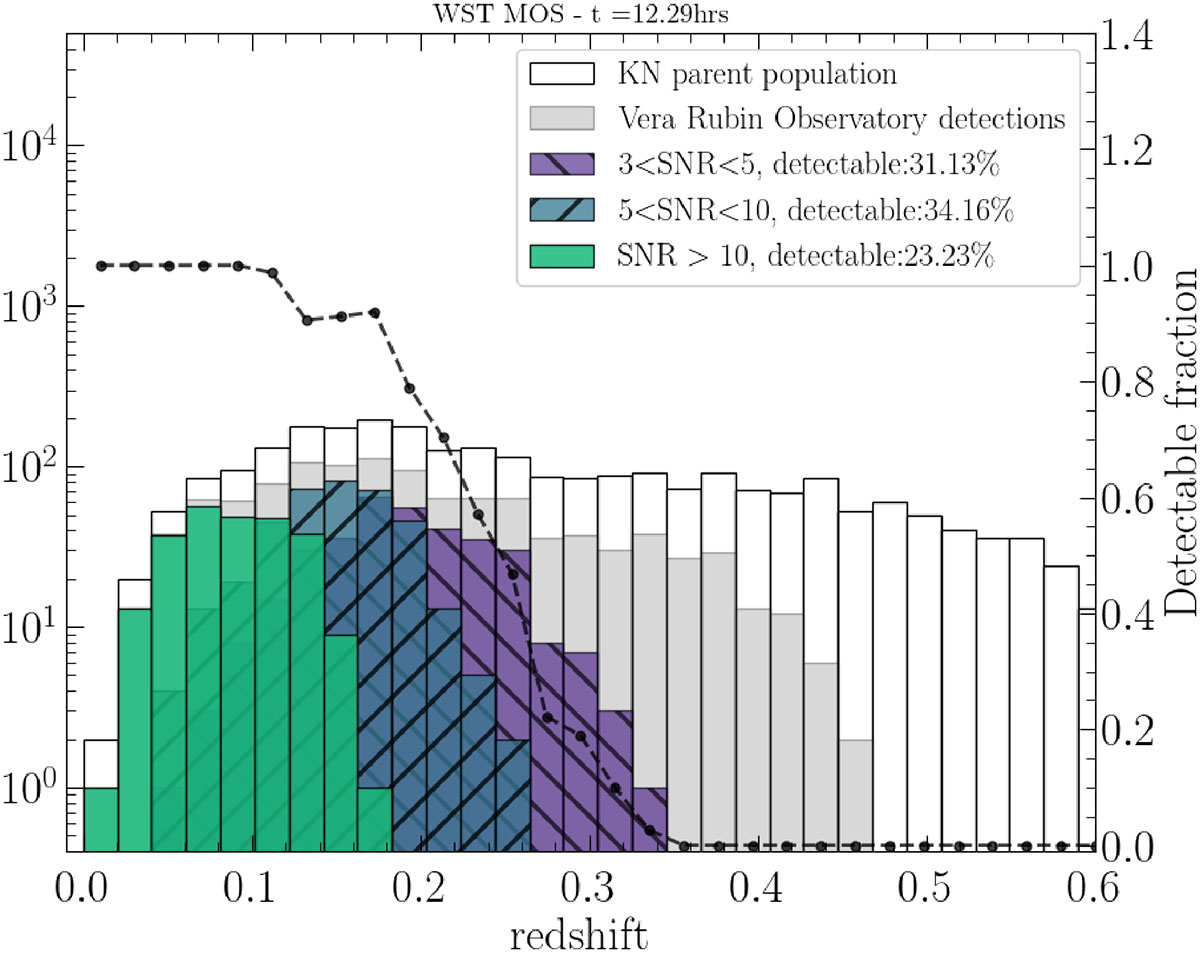
Redshift distribution of ET BNS detected over 10 years and the corresponding theoretical KN at ∼12 hours after the merger. The background distribution in white corresponds to the parent BNS + KN population. The colored distributions correspond to the EM counterparts that are detectable with WST MOS blue or orange or red arm, different colors corresponding to different S/N intervals. EM counterparts detectable with Rubin are shown in grey. Black points refer to the y axis ticks on the right hand side and show the fraction of detectable (S/N > 3) EM counterparts, with no additional information on the S/N range, with respect to Rubin detections.
Current usage metrics show cumulative count of Article Views (full-text article views including HTML views, PDF and ePub downloads, according to the available data) and Abstracts Views on Vision4Press platform.
Data correspond to usage on the plateform after 2015. The current usage metrics is available 48-96 hours after online publication and is updated daily on week days.
Initial download of the metrics may take a while.