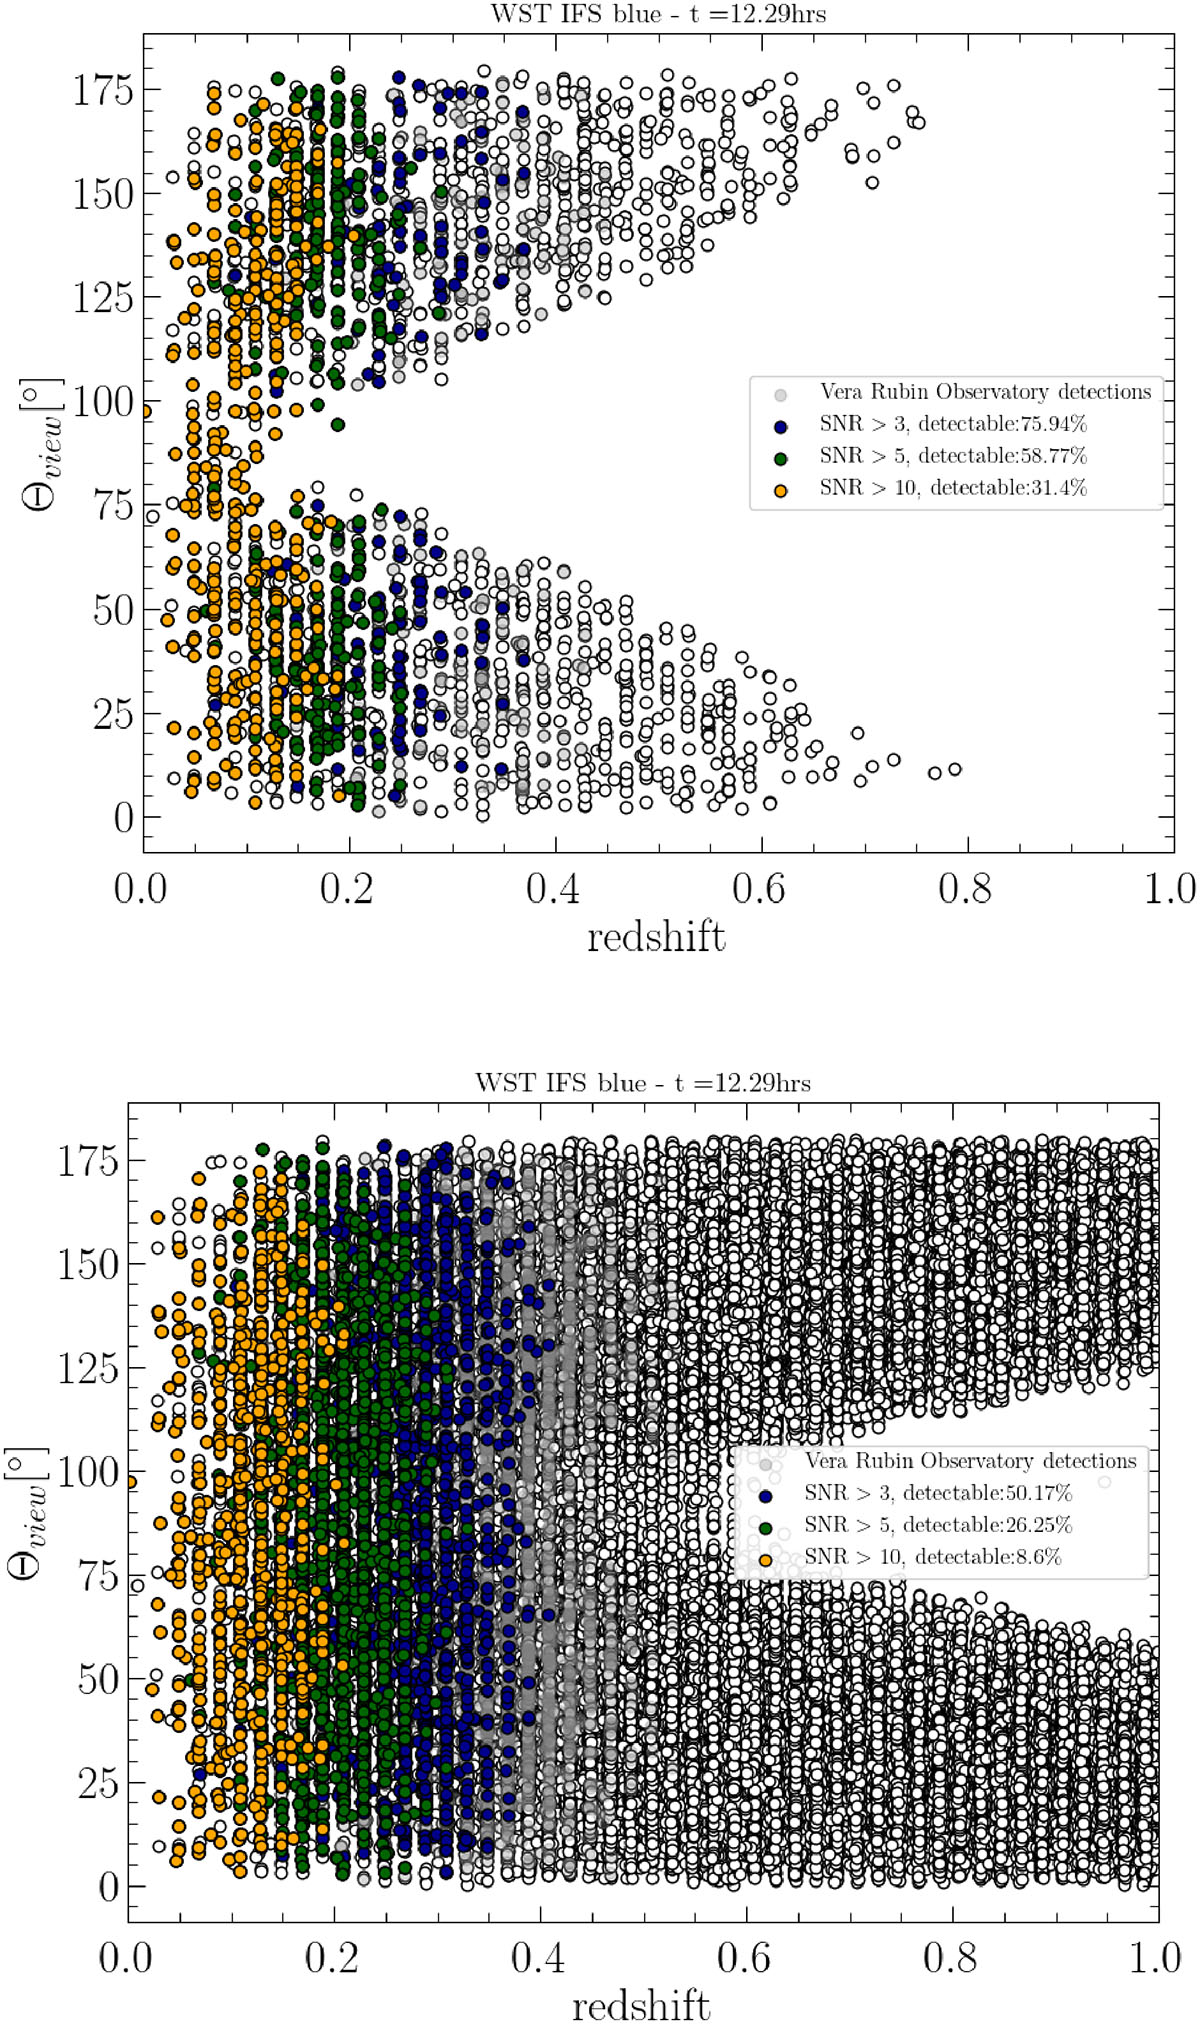
Fig. 6.
Download original image
Viewing angle as a function of redshift of theoretical KN following BNS mergers (white points) detected by ET alone (top panel) and ET in a network with CE (bottom panel). Colored points represent WST detections, different colors corresponding to different S/N. The lack in GW detections for edge-on systems is due to GW signal S/N, that is higher for face-on systems with respect to edge-on systems with the same intrinsic parameters.
Current usage metrics show cumulative count of Article Views (full-text article views including HTML views, PDF and ePub downloads, according to the available data) and Abstracts Views on Vision4Press platform.
Data correspond to usage on the plateform after 2015. The current usage metrics is available 48-96 hours after online publication and is updated daily on week days.
Initial download of the metrics may take a while.