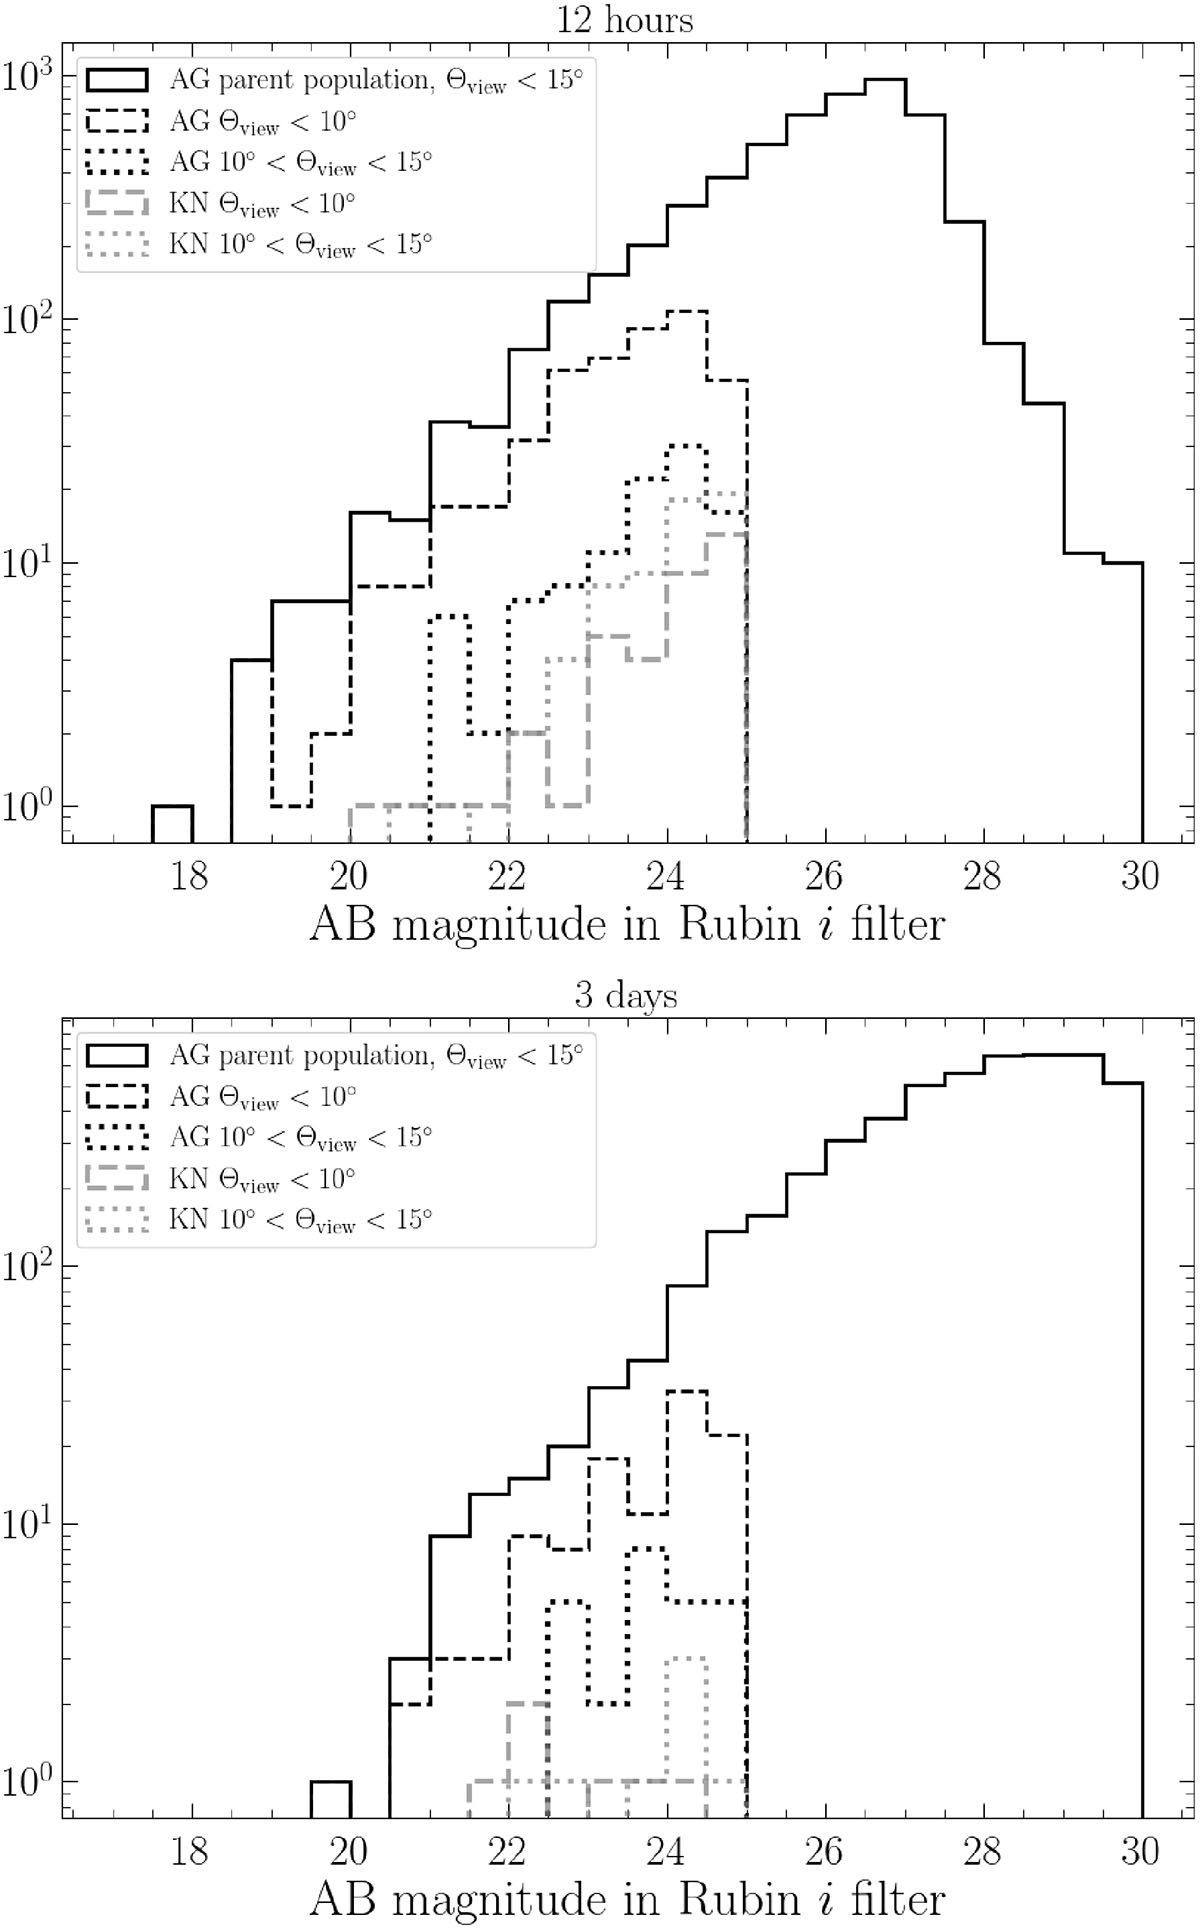
Fig. 7.
Download original image
Magnitude distribution in the Rubini filter (with a cut at m = 30) of afterglows produced by BNS mergers with a viewing angle below 15° (solid black line), at ∼12 hours (top panel) and ∼3 days (bottom panel) post-merger. Dashed- and dot-line black histograms correspond to events that are detectable with WST (i.e. where the combined flux of the afterglow and KN has S/N > 3) and for which the afterglow outshines the KN, for Θview < 10° and 10° < Θview < 15°, respectively. Dashed- and dot-line gray histograms represent detectable events where the kilonova dominates over the afterglow, for Θview < 10° and 10° < Θview < 15°, respectively.
Current usage metrics show cumulative count of Article Views (full-text article views including HTML views, PDF and ePub downloads, according to the available data) and Abstracts Views on Vision4Press platform.
Data correspond to usage on the plateform after 2015. The current usage metrics is available 48-96 hours after online publication and is updated daily on week days.
Initial download of the metrics may take a while.