Fig. 9.
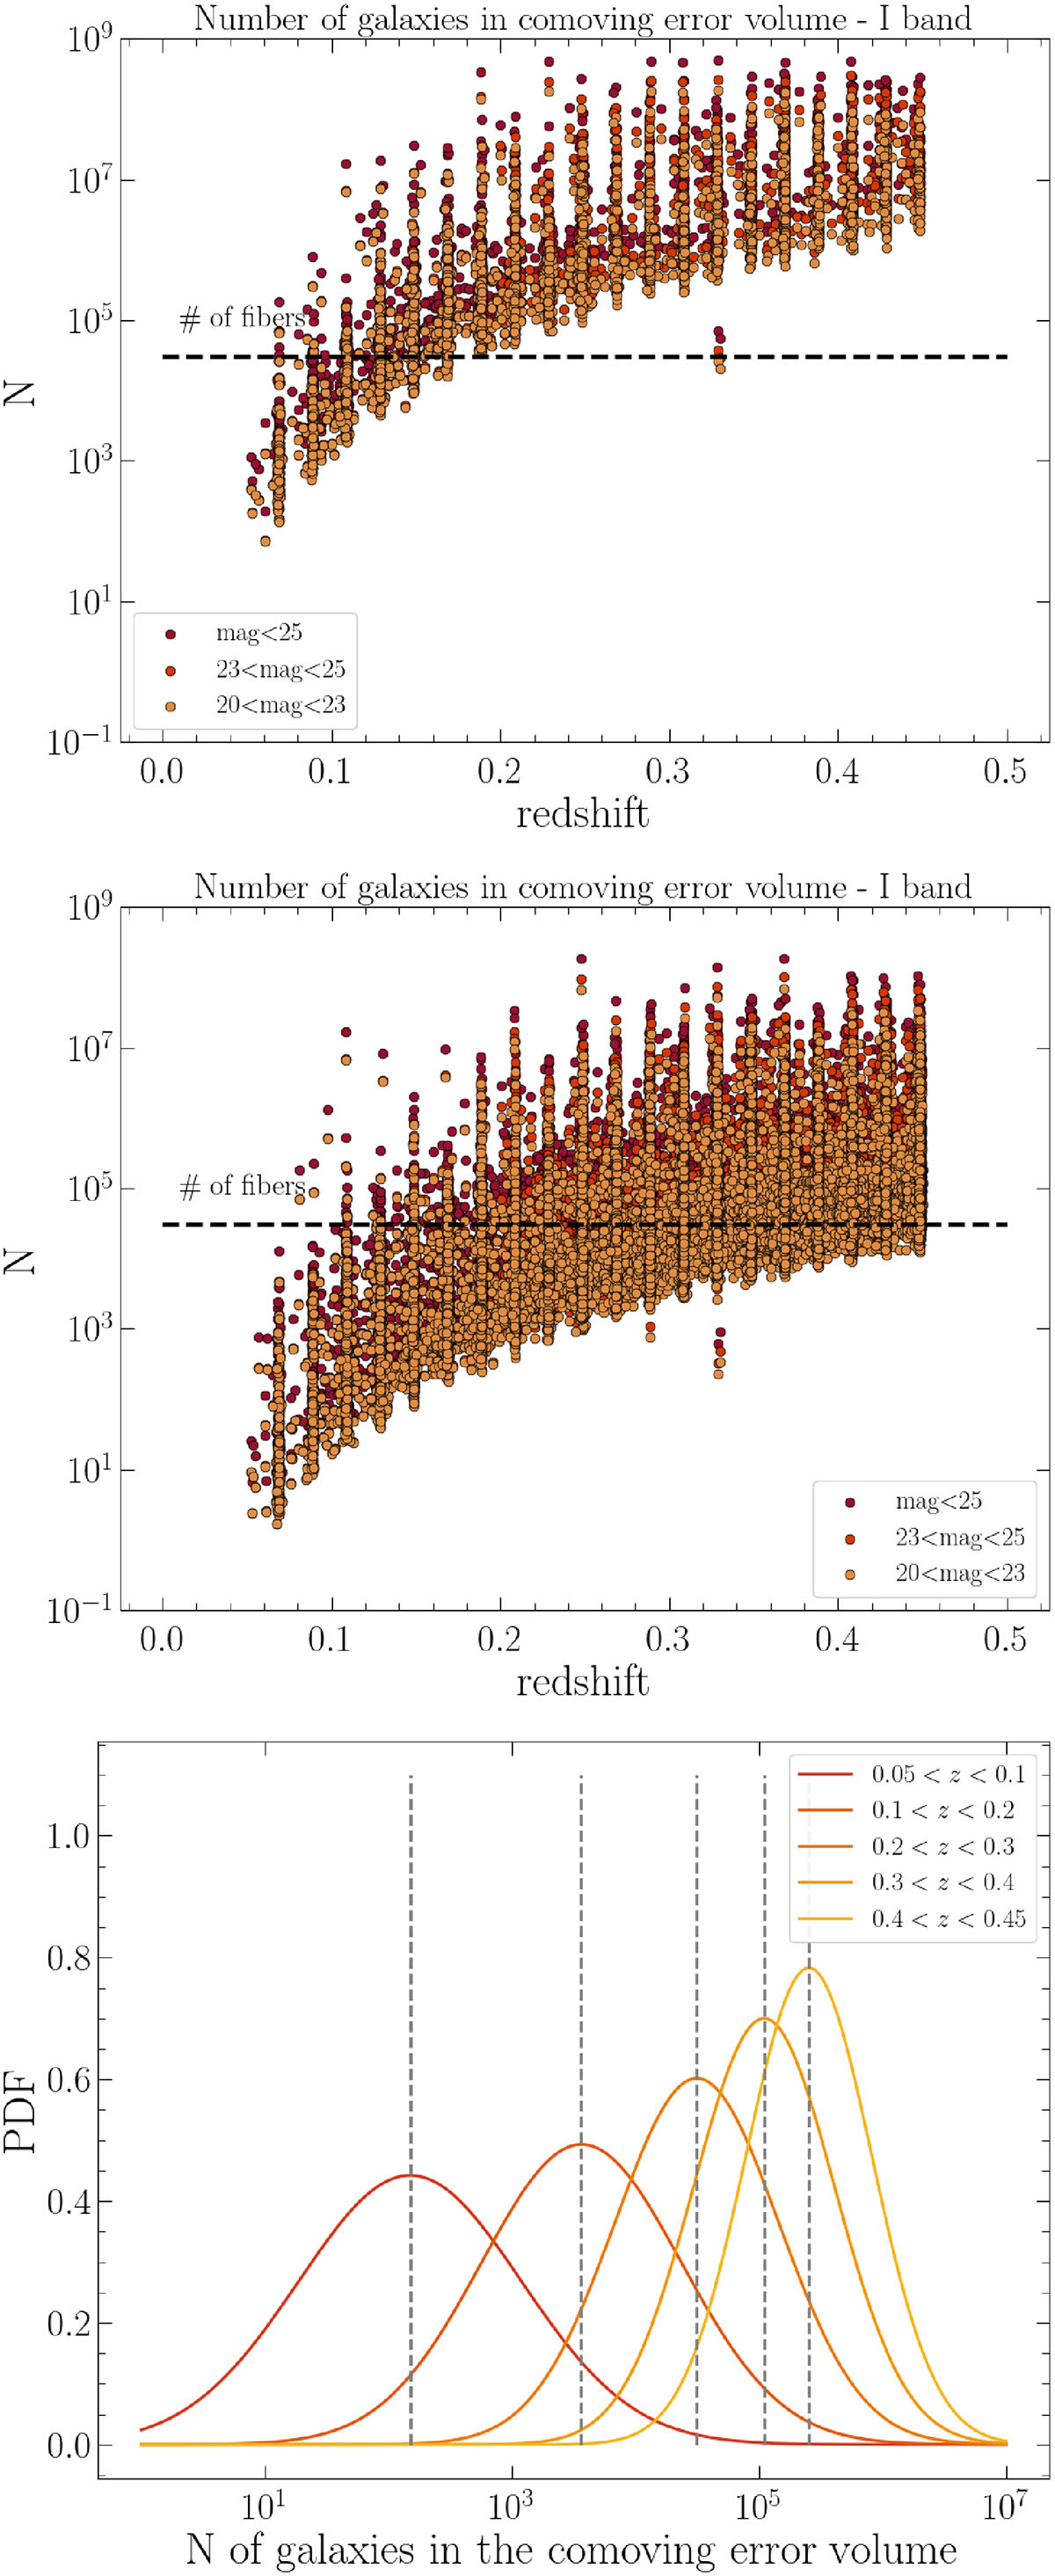
Download original image
Top: Number of galaxies in the comoving error volume of BNS detected by ET alone (top panel) and in a network with CE (middle panel). Each point corresponds to one GW BNS detection. Different colors correspond to different magnitude intervals. The black dashed line represents the number of WST fibres. Bottom: Probability distribution function of the number of galaxies with apparent I-band magnitude m < 25 that can be found in the comoving error volume of each BNS detected by ET + CE, for different redshift intervals. Dashed vertical lines indicate the mean value around which each Gaussian is centred.
Current usage metrics show cumulative count of Article Views (full-text article views including HTML views, PDF and ePub downloads, according to the available data) and Abstracts Views on Vision4Press platform.
Data correspond to usage on the plateform after 2015. The current usage metrics is available 48-96 hours after online publication and is updated daily on week days.
Initial download of the metrics may take a while.