Fig. 4
Download original image
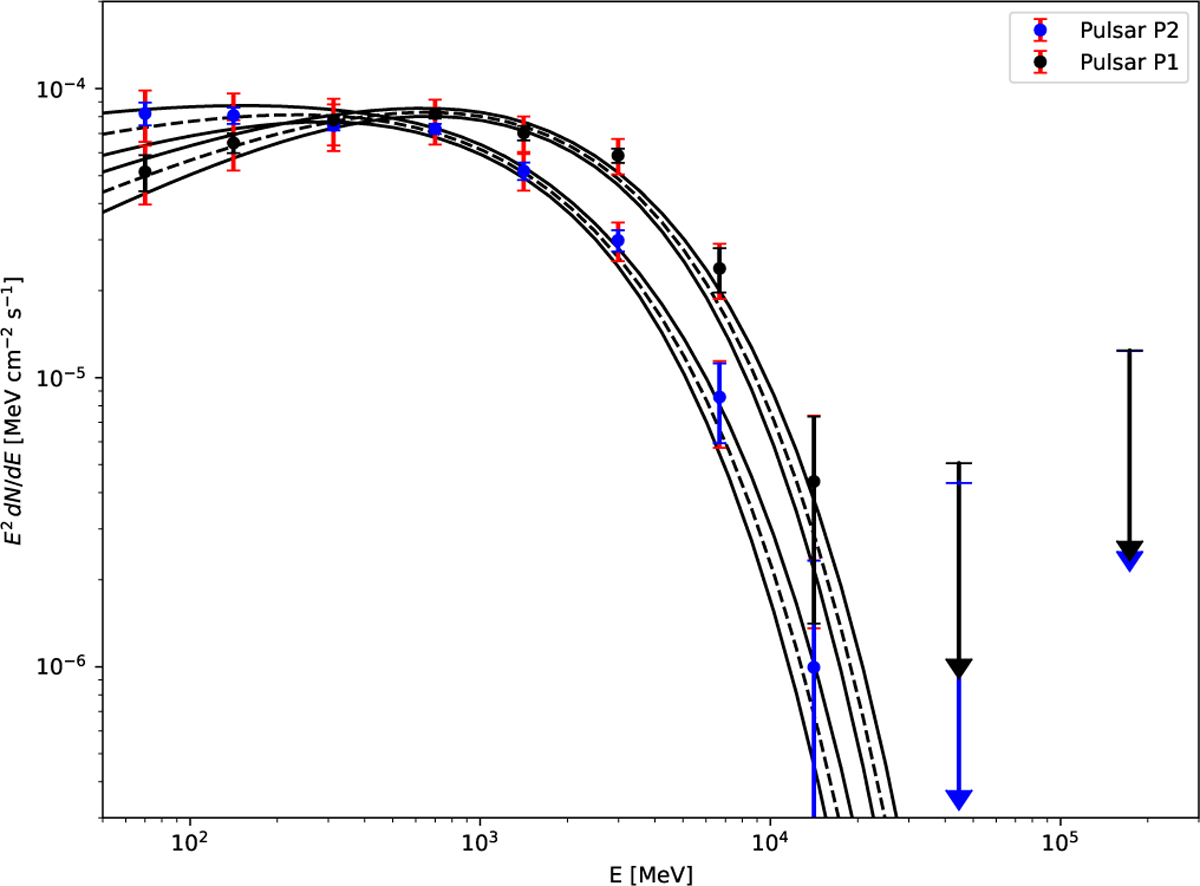
Fermi-LAT γ-ray spectra of the pulsar PSR J1124–5916 (4FGL J1124.7-5915) for the pulsed P1 peak (black dots) and pulsed P2 peak (blues squares) phase intervals. The solid black and dashed blue curves represent the best-fit sub-exponentially cutoff power-law models for the P2 and P1 phase intervals, respectively, over the 50 MeV–300 GeV energy range. The model shape follows that used for significantly curved pulsars in the 4FGL-DR3 catalog. The red error bars include both statistical and systematic uncertainties, with the latter primarily arising from the Galactic diffuse emission model and the IRFs at low energy. The butterfly region denotes the 1σ confidence interval of the best-fit spectral model.
Current usage metrics show cumulative count of Article Views (full-text article views including HTML views, PDF and ePub downloads, according to the available data) and Abstracts Views on Vision4Press platform.
Data correspond to usage on the plateform after 2015. The current usage metrics is available 48-96 hours after online publication and is updated daily on week days.
Initial download of the metrics may take a while.