| Issue |
A&A
Volume 705, January 2026
|
|
|---|---|---|
| Article Number | A218 | |
| Number of page(s) | 11 | |
| Section | Interstellar and circumstellar matter | |
| DOI | https://doi.org/10.1051/0004-6361/202556224 | |
| Published online | 23 January 2026 | |
Unlocking the radio- γ spectrum of the pulsar wind nebula around PSR J1124–5916 in SNR G292.0+1.8
1
Université Paris Cité, CNRS, Astroparticule et Cosmologie,
75013
Paris,
France
2
Instituto de Astronomía y Física del Espacio (IAFE), CONICET-Universidad de Buenos Aires,
Intendente Güiraldes 2160 ( C1428EGA), Ciudad Autónoma de Buenos Aires,
Argentina
3
Observatorio Astronómico Félix Aguilar (OAFA), FCEFyN – Universidad Nacional de San Juan,
Benavidez
8175 (O),
San Juan,
Argentina
★ Corresponding author: This email address is being protected from spambots. You need JavaScript enabled to view it.
Received:
2
July
2025
Accepted:
4
October
2025
Abstract
We present the first detection of GeV γ-ray emission potentially associated with the pulsar wind nebula (PWN) hosted by the young core-collapse supernova remnant G292.0+1.8, based on a detailed, time-resolved analysis of Fermi-LAT data. By isolating the unpulsed component from the dominant magnetospheric radiation of PSR J1124-5916, we successfully disentangled a candidate nebular emission in the GeV range, characterized its morphology, and extracted its spectrum. This identification places G292.0+1.8 among the few systems in which the pulsar and PWN contributions have been spectrally resolved at high energies, offering new insight into their respective emission mechanisms. We characterized the γ-ray spectrum of the pulsar and modeled the broadband spectral energy distribution (SED) of the PWN using radio, X-ray, and GeV data. The emission is well described by a single electron population with two spectral breaks: one intrinsic to the injection spectrum and another produced by synchrotron cooling in a magnetic field of ∼15μG. Notably, the inferred magnetic field and the low TeV flux of the nebula resemble those of 3C 58, suggesting that similar low-field environments can arise in young PWNe. The high-energy portion of the SED is now tightly constrained by our GeV detection and the existing TeV upper limits. Compared to our model, earlier predictions tend to underpredict the γ-ray flux, whereas others that succeed in reproducing the GeV component often overpredict the TeV emission. This mismatch underscores the challenges in modeling particle acceleration and radiation processes in young PWNe and establishes G292.0+1.8 as a valuable benchmark for testing and refining such models.
Key words: acceleration of particles / radiation mechanisms: non-thermal / ISM: supernova remnants pulsars: individual: PSR J1124-5916 / gamma rays: ISM / radio continuum: ISM
© The Authors 2026
 Open Access article, published by EDP Sciences, under the terms of the Creative Commons Attribution License (https://creativecommons.org/licenses/by/4.0), which permits unrestricted use, distribution, and reproduction in any medium, provided the original work is properly cited.
This article is published in open access under the Subscribe to Open model. This email address is being protected from spambots. You need JavaScript enabled to view it. to support open access publication.
1 Introduction
Pulsars (PSRs), the compact remnants of core-collapse supernovae, rank among the most energetic astrophysical sources in the Galaxy. Their magnetized, relativistic winds interact with the surrounding medium to form synchrotron-emitting structures known as pulsar wind nebulae (PWNe). These nebulae display broadband nonthermal emission from radio to X-rays, shaped by the properties of the central pulsar (e.g., spin-down luminosity and age) and by the characteristics of the local environment (see Gaensler & Slane 2006 for a review). At higher energies, many PWNe have also been detected in γ-rays, from MeV to TeV , primarily through inverse Compton scattering of ambient photon fields (de Jager et al. 2009; Acero et al. 2013; H. E. S. S. Collaboration 2018). These detections confirm the role of PSRs and their nebulae as key contributors to the leptonic component of Galactic cosmic rays (CRs).
Disentangling the emission from the pulsar and its surrounding nebula, however, remains a significant observational challenge across the electromagnetic spectrum. In the radio band, the pulsar's coherent emission often overwhelms the fainter synchrotron radiation from the PWN. In high-energy γ-rays, magnetospheric emission from the pulsar can outshine the nebular component-especially below ∼10GeV–while the limited angular resolution of current γ-ray instruments further complicates spatial analysis. These difficulties are compounded when the PWN is embedded within its host supernova remnant (SNR), as often occurs during the early evolutionary stages. As a result, only a few well-studied systems, such as the Vela complex, have provided robust isolation of the pulsar and nebular contribution through extensive, multiwavelength, morphological, and time-resolved analyses (e.g., Grondin et al. 2013; Lange et al. 2025). This paper presents one additional case within that limited set. We focus on resolving the γ-ray emission components of PSR J1124-5916 and its associated PWN. The pulsar is hosted by the young core-collapse SNR G292.0+1.8, an oxygen-rich remnant estimated to be ∼3000 years old (Winkler et al. 2009). The remnant exhibits bright, thermal X-ray knots and filaments confined within a faint radio shell, approximately 8' in diameter. Its X-ray morphology reveals a complex interplay between shocked circumstellar material (CSM) and metal-rich ejecta (see Bhalerao et al. 2019 and references therein). A lower limit on its distance of 6.2±0.9kpc was inferred from HI absorption measurements, implying a physical diameter of approximately 14.4 pc (Gaensler & Wallace 2003). Although no definitive interaction with molecular gas has been confirmed, Lee et al. (2010) proposed that variations in the electron temperature and emission measure in X-rays may indicate interaction with the red supergiant wind of the progenitor star.
With a spin-down luminosity of  erg s-1 and a rotation period of 135 ms , PSR J1124-5916 is among the most energetic Galactic pulsars known (Camilo et al. 2002b). Its wind powers a PWN that extends ∼1'.8×1' in X-rays and ∼4' in the radio band (Hughes et al. 2001; Gaensler & Wallace 2003), exhibiting a toroidal morphology with a jet-like structure reminiscent of other young PWNe, such as the Crab nebula and 3C 58 (Park et al. 2007). This torus has also been detected at optical and near-infrared (NIR) wavelengths (Zharikov et al. 2013).
PSR J1124-5916 was detected by the Fermi Large Area Telescope (Fermi-LAT; hereafter LAT) as a bright, pulsed γ-ray source (Abdo et al. 2010; Smith et al. 2023). The LAT spectral analysis reveals a hard power law with a super-exponential cutoff around several GeV (Smith et al. 2023). However, if the nebular contribution is not properly accounted for, the resulting pulsar spectrum may be biased. Identifying the unpulsed PWN component is therefore essential to accurately characterize the magnetospheric emission and to evaluate the nebular contribution at GeV energies. At TeV energies, although the region has been surveyed by the High Energy Stereoscopic System (H.E.S.S.) Galactic Plane Survey, no detection was achieved; only an upper limit of 0.27×10⁻¹² cm-2 s-1 has been established (H. E. S. S. Collaboration 2018).
The structure of this paper is as follows. In Sect. 2, we update the radio continuum spectrum of the PWN powered by PSR J1124–5916 by incorporating new data at frequencies below ∼1GHz. In Sect. 3, we analyze the γ-ray observations from LAT, and describe the methodology adopted to disentangle the nebular γ-ray emission from the pulsed component. Sect. 4 presents a broadband spectral energy distribution (SED) analysis of the PWN, modeling its emission from radio to γ-rays, and investigating the underlying particle populations and energy-loss mechanisms. This section also includes an in-depth discussion of the implications of our results. Finally, Sect. 5 summarizes the main conclusions of the study.
2 The radio dataset
To anchor the low-energy segment of the broadband SED of the PWN associated with PSR J1124–5916, we measured new radio flux densities from the Galactic and Extragalactic All-sky MWA Survey (GLEAM; Hurley-Walker et al. 2017), the Rapid ASKAP Continuum Survey (RACS; McConnell et al. 2020), and MeerKAT L-Band observations (Cotton et al. 2024)1. Instead of applying fixed geometric regions uniformly across all the radio images, we estimated the contribution from the surrounding SNR shell and the underlying Galactic background individually for each observing frequency. This was achieved by inspecting multiple horizontal and vertical intensity slices across the PWN region. These profiles allowed us to assess the combined level of large-scale emission projected along the line of sight, both from the SNR shell (in front of and behind the PWN) and from the diffuse Galactic background. The average of this total contribution was then subtracted from the flux measured within a region encompassing the PWN2. For instance, at 887.5 MHz, the combined emission unrelated to the PWN amounts to roughly 10% of the total flux within the selected region. The boundaries of this region, as well as those used to characterize the surrounding SNR emission, were determined by averaging several slightly different estimates of the outer perimeter, thereby accounting for uncertainties in separating the PWN from the extended SNR. A radio image of SNR G292.0+1.8 is shown in Fig. 1 (Left), including a zoomed-in view of the central region, which illustrates the morphology of the PWN and its surrounding structure. Using this procedure, our measurements improve the spectral coverage of the PWN at low and intermediate radio frequencies, extending well below the range probed by the earlier analysis of PSRJ1124–5916's PWN presented by Gaensler & Wallace (2003).
Table 1 summarizes the flux densities used in our analysis. To ensure a uniform flux scale, we corrected the new measurements to the absolute calibration of Perley & Butler (2017). Flux densities sourced from Gaensler & Wallace (2003) could not be corrected, as the calibrator used in their observations is not included in the Perley and Butler flux density scale. However, the expected correction factor is close to unity, and thus any systematic discrepancy is negligible within the uncertainties.
The compiled flux densities were then fit with a power-law model of the form Sv ∝ vα, where Sv denotes the flux density at frequency v and α is the spectral index. A single power-law slope α = –0.012 ± 0.010 provides an excellent fit to the data, with a reduced  (see Fig. 1, Right). This result is slightly flatter than the spectrum obtained when fitting only the high-frequency measurements (α1400-5000 MHz ∼–0.03,
  ; Gaensler & Wallace 2003), but remains consistent with the characteristically flat radio spectra observed in many PWNe, which typically exhibit spectral indices between 0.0 and –0.3 . Such flat spectra are generally attributed to the continuous injection of relativistic electrons by the pulsar wind, coupled with efficient synchrotron emission within the nebular magnetic field (Gaensler & Slane 2006). The complete radio dataset and the corresponding model will be included in a forthcoming catalog of SNR radio continuum spectra currently in preparation (Castelletti et al., in prep.).
3 Fermi-LAT data analysis
The LAT, aboard the Fermi Gamma-ray Space Telescope, is a pair-conversion γ-ray detector designed to survey the sky from 20 MeV to 1 TeV (Atwood et al. 2009). The third catalog of LAT-detected pulsars (3PC) currently lists over 340 bright point sources exhibiting pulsed γ-ray emission (Smith et al. 2023). Many of these pulsars are expected to power associated PWNe, as a significant fraction of their spin-down energy is channeled into a magnetized particle wind. This wind interacts with the surrounding supernova ejecta, continuously feeding the nebula and sustaining its nonthermal emission, which can potentially be detected in the LAT energy range. However, below ∼10GeV, the pulsed γ-ray emission from the pulsar typically dominates the signal, complicating the identification and characterization of any underlying PWN contribution in the LAT data (Ackermann et al. 2011; Rousseau et al. 2012). PSR J1124-5916 (associated with the source 4FGL J1124.7–5915) has been identified as a bright pulsed emitter in all Fermi LAT pulsar catalogs to date (Abdo et al. 2010; Abdo et al. 2013; Smith et al. 2023). Its phase-averaged γ-ray spectrum displays strong emission up to ∼10 GeV, beyond which a pronounced spectral cutoff is observed. Intriguingly, above this cutoff, a residual emission component persists, extending up to ∼1 TeV (Smith et al. 2023). In this section, we investigate the possibility that this high-energy residual emission originates from a yet-undetected PWN by providing a detailed data analysis of the available LAT dataset.
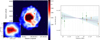 |
Fig. 1 Left: radio image of SNR G292.0+1.8 from the Rapid ASKAP Continuum Survey at 887.5 MHz , showing the full extent of the remnant. The color scale (square-root scale, in units of Jy beam-1 is adjusted to enhance the visibility of the shell structure; consequently, the central PWN appears saturated. A zoom-in on the PWN is shown in the inset, where the square-root color scale ranges from 0.015 to 0.4 Jy beam-1 and is optimized to highlight the internal PWN morphology. The contours in the inset are drawn at 0.07, 0.13, 0.18, and 0.3 Jy beam-1 and are shown for reference to delineate internal structures. The yellow cross marks the position of the PSR J1124–5916. The synthesized beam is 25''×25'', and the rms noise level is 0.5 mJy beam-1. Right: updated radio continuum spectrum of the PWN associated with PSR J1124-5916 within SNR G292.0+1.8. Green diamonds correspond to the new flux density measurements obtained in this work from radio surveys, whereas orange symbols represent values compiled from the literature (see Table 1). The solid line indicates the best fit to the weighted data, yielding a radio spectral index of α=-0.012 ± 0.010. The shaded gray and light blue bands denote the 1σ and 2σ statistical uncertainties in the best-fit α value, respectively. |
3.1 Analysis framework
3.1.1 Data reduction
Data reduction and exposure calculations were carried out using the Fermi Science Tools (fermitools, version 2.2.0) in conjunction with the fermipy (version 1.1.6) analysis package (Wood et al. 2021). We used the Pass 8 third release (P8R3) photon data and the corresponding instrument response functions (IRFs: P8R3_SOURCE_V6), which offers improved event reconstruction and enhanced background rejection (Atwood et al. 2013; Ajello et al. 2021).
To ensure data quality and minimize systematic uncertainties, we excluded events with energies below 50 MeV, where the LAT response function becomes increasingly uncertain. We further applied a zenith angle cut of < 90∘ to reduce contamination from Earth-limb γ-rays and restricted the analysis to good time intervals, thus excluding periods affected by transient spacecraft conditions or South Atlantic Anomaly passages, where increased radiation levels can degrade instrument performance.
3.1.2 Binned likelihood analysis
Full dataset γ-ray analysis was performed over the 50 MeV to 1 TeV energy range using logarithmic energy binning, with eight bins per decade, across a 6°×6° ROI centered on the position of 4FGL J1124.7-5915. A standard binned maximum likelihood analysis was conducted using a source model that incorporates both diffuse emission components and nearby γ-ray sources from the incremental fourth Fermi-LAT source catalog (4FGL-DR4; Abdollahi et al. 2022; Ballet et al. 2023) located within 10° of the target position. To improve the robustness of the analysis, sources with a test statistic (TS) < 4 (σ < 2) were excluded from the model. The Galactic diffuse emission was modeled using the gll_iem_v06 template, while the isotropic background was described with the iso_P8R2_SOURCE_V6_v06 model3. The scaling factor for the Galactic diffuse component and the normalization of the isotropic background were both left free to vary during the fit.
Although the LAT point spread function (PSF) degrades at low energies, we chose to perform both morphological and spectral analyses over the full energy range. This strategy maximized sensitivity and improved our ability to disentangle the contribution from the pulsar itself and any extended emission potentially associated with the surrounding nebula. As part of the subsequent analysis, we produced TS maps for γ-ray photons with energies exceeding 1 GeV, to examine the morphology of the source in an energy range where the point spread function (PSF) is sufficiently well constrained to allow meaningful spatial characterization.
3.1.3 Evaluation of systematic errors
A key source of systematic uncertainty in spectral analysis arises from limitations in the instrument response function, particularly in the estimation of the effective LAT area. To account for this, we applied two bracketing scaling functions to the effective area, following the methodology outlined in Ackermann et al. (2012a).
For sources located above the Galactic plane, additional systematic uncertainties in the γ-ray spectrum arise from the modeling of large-scale emission components. These components include contributions from extended nearby sources, as well as diffuse Galactic γ-ray emission (DGE). To assess the impact of these uncertainties, we varied the normalization of the DGE model by ±6%, following the approach adopted by Abdo et al. (2009) and consistent with the level of systematics evaluated by Ackermann et al. (2012b). The two dominant sources of systematic uncertainty - instrument response and diffuse emission modeling - were then combined in quadrature with the statistical errors to determine the total uncertainty intervals associated with the flux points presented in the γ-ray spectrum.
3.2 Phase-resolved analysis
To explore the possibility that part of the high-energy emission in the direction of 4FGL J1124.7-5915 originates from a yetundetected PWN, we first performed a phase-resolved spectral analysis. This approach involved isolating the unpulsed component by filtering out the pulsed signal from the dataset, thereby enhancing sensitivity to any steady γ-ray contribution from the nebula.
3.2.1 Data selection and preparation
The phase-resolved analysis required assigning rotational phases to γ-ray photons and selecting those that fall within an off-pulse window. These phased events were obtained from the FT1 event file provided by the 3PC, made available through the FSSC data access portal4. The file includes all reconstructed events in the 50 MeV–300 GeV energy range in a 3° region around PSR J1124-5916 and features two additional columns: PHASE and MODEL_WEIGHT. These columns contain, respectively, the rotational phase of each photon and the probability that the photons originate from the pulsar, based on LAT's energy-dependent PSF and the angular offset between the photon direction and the pulsar position. Photon arrival times were converted into rotational phases using pulsar timing models derived from long-term timing campaigns, as described in the 3PC (Smith et al. 2023). Figure 2 displays the phase-folded pulse profile of PSR J1124-5916, constructed from photons with energies E > 50 MeV within an angular radius of 0.2° centered on the pulsar. Two distinct peaks, previously identified by Abdo et al. (2010); Abdo et al. (2013) and Smith et al. (2023), are clearly visible and separated by ∼0.5° in phase. Hereafter, we refer to the brighter peak, centered at phase 0.65°, as P1, and to the smaller peak, centered at 0.16°, as P2.
The off-pulse regions of the light curve, located between P2 and P1 (phase intervals 0.2-0.5 and 0.7-1.0 ), span over 50% of the pulsar's rotational period. For the purposes of this study, we defined the on-pulse intervals as 0.635–0.66 for P1 and 0.13–0.16 for P2, consistent with prior Fermi-LAT analyses (Abdo et al. 2010). These on-pulse windows were defined by restricting to regions where the photon count exceeded 50% of the maximum peak amplitude, to minimize contamination from potential PWN emission. To ensure robust analysis and minimize contamination from potential residual pulsed emission between peaks, we adopted the off-pulse phase interval 0.7–1.0, consistent with the Fermi-LAT pulsar catalog definition (Abdo et al. 2010). We segmented the full dataset into three phase intervals – P1, P2, and OFF - and each window was analyzed independently using the binned likelihood method outlined in Sect. 3.1.2.
To prevent contamination of off-pulse phase regions caused by model inaccuracies at later epochs, we restricted the phase-resolved analysis to the valid timing intervals specified in the 3PC. This interval spans 11.8 years of LAT observations, from MJD 54682 (August 4, 2008) to MJD 59000 (May 31, 2020) (Smith et al. 2023).
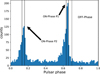 |
Fig. 2 Phase profile constructed using photons with energies above 50 MeV within a region of 0.2 around PSR J1124–5916. The profile spans one full rotation, divided into 100 bins. The two dashed and solid vertical lines represent the off-pulse and on-pulse windows, respectively, as defined in the text and used in the phase-resolved analysis. |
3.2.2 Off-phase analysis: Search for unpulsed emission
The off-pulse dataset was analyzed using the likelihood adjustment method described in Sect. 3.1.2. Initially, all sources within 15° of PSR J1124–5916’s position listed in the third incremental update to the original 4FGL catalog (4FGL-DR3) were included in the source model, adopting their spectral forms and parameters as provided in the catalog. For sources within a 3° radius of PSR J1124–5916, the spectral normalization parameters were allowed to vary freely, while all other source parameters were fixed to their catalog values. The normalizations of both the Galactic and extragalactic diffuse emission components were also left free during the fit. To search for residual unpulsed emission, we removed 4FGL J1124.7–5915 (the point source associated with PSR J1124-5916) from the source model and generated a residual TS map. As shown in Fig. 3, the TS map revealed significant excess γ-ray emission near the pulsar position, with a peak TS value of ∼37, corresponding to a detection significance of approximately 6σ.
We then introduced a new point source at the pulsar's position, modeled with a simple power-law spectrum. A likelihood fit was performed with all source parameters free to vary. The inclusion of this source resulted in ΔTS=37, confirming a detection at the 6.1σ level. Using fermipy, we localized the new source to Galactic coordinates l = 291.99° ±0.03°, b = 1.77° ± 0.03°, and determined a 68% confidence positional uncertainty of 0.047° (see Table 2). To evaluate whether the emission was spatially extended, we fitted a two-dimensional symmetric Gaussian model using the gta.extension function in fermipy. The extension significance, calculated using the test statistic TS = 2 Δ log (likelihood), yields TS =0.6. This result indicates that the emission is not significantly extended, consistent with an upper limit on the extension at the 95% confidence level of 0.143°. Figure 3 shows the TS map above 1 GeV, overlaid with the 68% confidence error radius for the best localization and the 95% confidence upper limit on the source extension.
The γ-ray spectrum of the candidate source was extracted assuming a point source located at the best-fit position. We performed a maximum likelihood fit across eight logarithmically spaced energy bins per decade, spanning the 50MeV–300GeV range. The resulting spectral shape is well represented by a hard power law, characterized by a photon index Γ=1.99±0.15 and a total energy flux 6.399×10⁻¹² erg s-1 cm-2 above 50 MeV.
The absence of a significant spectral cutoff up to 300 GeV in the power-law spectrum, coupled with the relatively hard photon index, strongly suggests that this emission does not originate from residual magnetospheric radiation in the off-pulse window of PSR J1124–5916. The spatial coincidence of the detected source with the radio and X-ray PWN of PSR J1124–5916 supports this association. In contrast, the radio emission from the shell of G292.0+1.8 exhibits a plateau-like morphology, with an approximately constant flux that extends well beyond the observed size of the γ-ray source, out to a radius of ∼4'. Furthermore, the lack of detected synchrotron X-ray emission from the shell challenges the scenario in which the γ-ray emission arises from high-energy electrons associated with the SNR shell. Although a contribution from hadronic processes - i.e., accelerated protons in the shell interacting with ambient material - cannot be entirely ruled out, we consider this explanation less likely given the moderate ambient density (0.5–0.9 cm-3) inferred from previous studies (Gaensler & Wallace 2003; Lee et al. 2009).
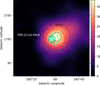 |
Fig. 3 Fermi-LAT TS map of the region surrounding PSR J1124–5916 for energies above 1 GeV in Galactic coordinates during the OFF-pulse phase interval. All sources in the 4FGL-DR3 catalog were included, except the pulsar source 4FGL J1124.7–5915, which was removed from the model. The color bar indicates the TS value range. The white star marks the position of PSR J1124-5916. The dash-dot black circle represents the 1σ error radius for the best-fit position obtained in the off-pulse phase interval analysis, while the dashed black circle indicates the 95% confidence level upper limit on the source extension. Light blue contours show radio data from the Molonglo Observatory Synthesis Telescope (MOST), highlighting the extent of the radio PWN; the green circle corresponds to the X-ray PWN extension detected by Chandra (Hughes et al. 2003), and the red circle indicates the SNR G292.0+1.8 extension. |
Fermi-LAT morphological parameters for the new PWN candidate associated with PSR J1124–5916.
3.2.3 ON-phase analysis: Measurement of PSR J1124–591 pulsed spectrum
In this section, we analyze the on-phase γ-ray data corresponding to the P1 and P2 phase windows. A standard binned likelihood analysis was performed on the LAT data, following the methodology described in Sect. 3.1.2. To account for the contribution from the PWN candidate identified in the off-pulse analysis, we incorporated its emission into the on-pulse fit. Specifically, the PWN candidate emission was included as a fixed component in the spectral model for the pulsed-emission analysis, with its contribution adjusted by rescaling the exposure to reflect the shorter duration of the on-pulse phase. We modeled the contribution of the pulsar PSR J1124–5916 (4FGL J1124.7–5915) using a power law with a super-exponential cutoff, known as the PLEC4 model (PLSuperExpCutoff4 in Fermitools). This spectral form, which includes a super-exponential index b < 0, is consistent with the form used in the 4FGL-DR3 catalog (Abdollahi et al. 2022) and in the 3PC (Smith et al. 2023). The functional form of the PLEC4 model is given by
![Mathematical equation: ${{{\rm{d}}N} \over {{\rm{d}}E}} = {N_0}{\left( {{E \over {{E_0}}}} \right)^{ - \gamma + {d \over b}}}\exp \left[ {{d \over {{b^2}}}\left( {1 - {{\left( {{E \over {{E_0}}}} \right)}^b}} \right)} \right],$](/articles/aa/full_html/2026/01/aa56224-25/aa56224-25-eq4.png) (1)
(1)
where N0 is the normalization, γ is the power-law index, d is the local curvature at the reference energy E0 (in GeV), and b is the super-exponential index, which was fixed to 2/3. The best-fit spectral parameters for the pulsed emission of PSR J1124–5916 are summarized in Table 3. The resulting energy flux, spectral index, and exponential cutoff parameters are consistent with values reported in the 4FGL-DR3 and 3PC catalogs (Abdollahi et al. 2022; Smith et al. 2023).
Figure 4 shows the best-fit spectral model along with the flux points derived for the pulsed emission of PSR J1124–5916. We obtained the flux points by dividing the energy range from 50 MeV to 300 GeV into ten logarithmically spaced energy bins. In each bin, a maximum likelihood spectral analysis was performed using a power-law shape with a fixed photon index of 2 for the source. This was accomplished using the gta.sed function in fermipy. During the bin-by-bin analysis, the normalizations of the diffuse Galactic and isotropic emission components, as well as those of all sources within 3° of the pulsar position, were allowed to vary freely. A 95% confidence upper limit was calculated when the significance value of a flux point was below 3σ.
Spectral results for the γ-ray pulsar PSR J1124–5916.
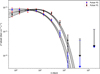 |
Fig. 4 Fermi-LAT γ-ray spectra of the pulsar PSR J1124–5916 (4FGL J1124.7-5915) for the pulsed P1 peak (black dots) and pulsed P2 peak (blues squares) phase intervals. The solid black and dashed blue curves represent the best-fit sub-exponentially cutoff power-law models for the P2 and P1 phase intervals, respectively, over the 50 MeV–300 GeV energy range. The model shape follows that used for significantly curved pulsars in the 4FGL-DR3 catalog. The red error bars include both statistical and systematic uncertainties, with the latter primarily arising from the Galactic diffuse emission model and the IRFs at low energy. The butterfly region denotes the 1σ confidence interval of the best-fit spectral model. |
3.3 Analysis with the full LAT dataset
To improve the statistical reliability and derive the most accurate spectral and morphological parameters for the newly detected source, we performed a final analysis using the entire available LAT dataset. Since the timing analysis used in the previous section does not cover the full observation period considered here, and because PSR J1124-5916 experiences frequent glitches (Ge et al. 2020), our analysis of the full dataset is not phase-resolved. Instead, we exploited the distinct spectral shapes of 4FGL J1124.7-5915 and the detected PWN candidate, which, combined with the large photon statistics, allowed us to separate the two sources.
3.3.1 Data selection
For this study, we analyzed a region of interest (ROI) centered on the position of PSR J1124–5916, corresponding to the 4FGL catalog source 4FGL J1124.7–5915 (RA =11h24m29.57905s, Dec =–59d12m49.9589s). The ROI spans a 6°×6° area, and the dataset includes 15 years of LAT observations, from August 4, 2008 to August 5, 2023. This extensive time baseline provides a high-statistics dataset suitable for detailed spectral modeling, enabling a refined investigation of γ ray emission that was unfeasible in previous studies (Smith et al. 2023).
3.3.2 Morphological study of the PWN candidate
For the morphological analysis, we adopted the same binned likelihood fitting procedure outlined in Sect 3.1.2. The source model incorporated both the known γ-ray pulsar 4FGL J1124.7–5915 and the newly detected PWN candidate, along with all other catalog sources within a 4° radius of 4FGL J1124.7–5915 from the 4FGL-DR3 catalog. For sources within a 4° radius of PSR J1124–5916, the spectral normalization parameters were allowed to vary freely. All other source parameters were fixed to their catalog values. Additionally, the normalization factors of both the Galactic and extragalactic diffuse emission components were allowed to vary during the fitting process.
In this analysis, the PWN candidate is detected with a statistical significance of 7σ, while 4FGL J1124.7–5915 reaches a 95σ detection level. The best-fit position and spatial extension of the PWN candidate, updated using the full LAT dataset, are reported in Table 2. The position of the detected PWN candidate is consistent with that obtained from the off-pulse analysis, differing by only a minor offset of a few arcminutes. We tested for possible spatial extension of the source, obtaining a best-fit Gaussian width of 0.104° at a significance level of 2.4σ. As this does not constitute a significant detection of extension, we established a 95% confidence level upper limit on the source extension of 0.165°, closely matching the value inferred from the OFF-pulse analysis. Figure 5 displays, from left to right, the LAT TS maps corresponding to (i) the full model excluding the pulsar 4FGL J1124.7–5915, (ii) the full model excluding the newly detected PWN candidate, and (iii) the residual excess map derived from the full model including both sources. The maps demonstrate that the distinct spectral characteristics of the pulsar and the PWN enable a clean separation of their contributions. The total model adequately reproduces the observed γ-ray emission across the 50MeV–1 TeV energy range. As shown in Fig. 5, the γ-ray emission associated with the newly detected source coincides spatially with the radio PWN of PSR J1124–5916, which spans a radius of 130'', corresponding to 3.8 pc at a distance of 6 kpc (Gaensler & Wallace 2003) The pulsar PSR J1124–5916 also powers an X-ray PWN, consisting of a compact bright structure of 5'' and a more extended component reaching out to 65'' (Hughes et al. 2001; Safi-Harb & Gonzalez 2002; Hughes et al. 2003; Park et al. 2007), indicated by the green circle in Fig. 5.
Generally, the discrepancy in size and morphology between the X-ray and γ-ray PWNe reflects the distinct populations of electrons responsible for each emission process. The X-ray PWN arises from synchrotron radiation produced by freshly injected high-energy electrons, while the γ-ray PWN is primarily shaped by older, lower-energy electrons undergoing inverse Compton (IC) scattering (Mattana et al. 2009; de Jager et al. 2009). For the PWN candidate in SNR G292.0+1.8, the γ-ray emission is not spatially resolved; however, the derived upper limit on its extent exceeds the size of the X-ray PWN. The X-ray PWN morphology is relatively unaffected by pulsar motion or interactions with the SNR's reverse shock, as expected in systems several thousand years old. In contrast, the γ-ray PWN morphology is more sensitive to such dynamical effects. Given their lower energy, the electrons responsible for radio synchrotron emission are expected to trace the larger-scale structure of the γ-ray PWN.
In SNR G292.0+1.8, PSR J1124–5916 is offset by approximately 46'' (∼1.34 pc at a distance of ∼6 kpc) southeast of the presumed explosion center, implying a transverse velocity of ∼500" km s-1. Fig. 5 shows that the pulsar is located near the southeastern edge of the radio PWN, roughly 90'' from the nebula’s outer edge in the direction of motion, and ∼160'' from the opposite boundary. This pronounced asymmetry suggests that the PWN evolved within an inhomogeneous ambient medium, shaped by the pulsar's motion and possibly influenced by environmental gradients or interactions with the reverse shock.
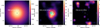 |
Fig. 5 Zoomed-in views of the >1 GeV Fermi-LAT total dataset TS maps in a 2°×2° region centered on 4FGL J1124.7–5915. Left: residual TS map with all 4FGL-DR3 sources except PSR J1124-5916 / 4FGL J1124.7–5915 and the newly detected source. The map highlights the pulsar emission. Middle: residual TS map with all 4FGL-DR3 sources, including 4FGL J1124.7-5915, with best-fit parameters derived from the likelihood analysis. The map highlights the excess emission associated with the newly detected source corresponding to the PWN hosted in SNR G292.0+1.8. The dash-dotted black circle indicates the best-fit position of the new source, with the radius corresponding to the 68% confidence positional uncertainty. The 95% confidence upper limit on the source extension is shown by a larger dash-dotted black circle. The position of PSR J1124–5916 / 4FGL J1124.7–5915 is marked with a white star. Radio contours are overlaid in cyan; the green circle corresponds to the X-ray PWN extension detected by Chandra (Hughes et al. 2003), and the red circle indicates the SNR G292.0+1.8 extension. Right: residual TS map for the complete source model, including all 4FGL-DR3 sources, PSR J1124–5916/4FGL J1124.7–5915, and the newly detected source, demonstrating that the emission is well accounted for. |
3.3.3 Spectrum
Using the best-fit spatial parameters for the new PWN candidate, we repeated the spectral analysis over the 50 MeV-1TeV energy range, incorporating all sources from the 4FGL-DR3 catalog within a 10° radius, following the same approach as described in previous sections. The spectral parameters for 4FGL J1124.7–5915 and the newly detected source are reported in Table 3, together with their associated statistic and systematic uncertainties. The spectrum of the new PWN candidate is well described by a power law with a hard index, extending up to 500 TeV, in full agreement with the spectral shape from the off-pulse analysis. To construct the SEDs for both sources, we divided the energy range into ten logarithmically spaced energy bins and derived the corresponding LAT spectral flux points. Fig. 6 shows the resulting SEDs of PSR J1124–5916 and its candidate PWN. Systematic uncertainties for each flux point were estimated as described in Sect. 3.1.3. Assuming the PWN candidate is associated with PSR J1124–5916, the luminosity of this source is estimated to be L(50 MeV – 1 TeV) = 1.76 ×1034(D6 kpc)2 erg s-1, for a distance D = 6 kpc. The adopted distance of 6 kpc for the PWN is well supported by multiple independent measurements, including 6.2 ± 0.9kpc from Hi emission and absorption and 6.4 ± 1.3 kpc from the pulsar’s dispersion measure (Gaensler & Wallace 2003).
4 Discussion
4.1 General context
In the Galaxy, only five other PWNe - besides that in SNR G292.0+1.8 - powered by pulsars with spin-down luminosities exceeding 1037 erg s-1 have been detected in the GeV range with LAT: the Crab nebula, 3C 58, and those within the SNRs Vela, MSH 15–52, and HESS J1813-178 Abdollahi et al. 2022; Ballet et al. 2023. With the exception of Vela, all these systems are younger than 10 kyr , with the Crab nebula and 3C 58 among the youngest, having estimated ages below 5 kyr (Rudie et al. 2007; Fesen et al. 2008). Therefore, LAT detection of the PWN in G292.0+1.8 adds a third member to this rare group of very young and powerful sources.
Although we demonstrate that the PWN in G292.0+1.8 shines brightly in the GeV range, it remains the only undetected nebula at TeV energies among Galactic systems hosting pulsars with spin-down luminosities above 1037 erg s-1. The upper limit on its TeV luminosity, as reported by the H.E.S.S. collaboration study of the Galactic PWN population (H. E. S. S. Collaboration 2018), implies a maximum TeV luminosity of 1033 erg s-1, assuming a distance of 6 kpc.
Interestingly, the PWN in G292.0+1.8 exhibits a high luminosity in the radio band. Its radio-to-TeV luminosity ratio, Lr =Lradio/Lγ(TeV) ≥ 0.4, ranks among the highest in the known population, placing it alongside 3C 58 and the Crab nebula. Similarly, its X-ray-to-TeV luminosity ratio, LX=LX-ray/Lγ(TeV) ≥ 40, is comparable to that of 3C 58 (An 2019). Only three other PWNe exhibit a larger LX ratio: G21.5–0.9 and the Crab nebula in the Galaxy, and N 158A in the Large Magellanic Cloud (Zhu et al. 2018). These high Lr and LX values suggest that the nebula is an efficient emitter in the radio and X-ray bands, but a relatively weak source at TeV energies. Indeed, the nebula associated with PSR J1124-5916 in G292.0+1.8 appears as an outlier in the established correlations between spin-down power and radio and X-ray luminosities. It lies far beyond the 2σ confidence bands of the  and
and  correlations for Galactic PWNe powered by high spin-down luminosity pulsars, most of which are also effective TeV emitters (Zhu et al. 2018). Nevertheless, the significant GeV emission detected from the PWN in G292.0+1.8 indicates that its particles can radiate efficiently at high energies (see Sect. 3). This behavior provides valuable insight into the energy-dependent particle acceleration and cooling in young PWNe.
When comparing PWNe powered by pulsars with similar ages and spin-down luminosities, their broadband emission properties can differ significantly. For example, the PWN in G292.0+1.8 resembles 3C 58 in several key respects: both are associated with energetic young pulsars with ages around 2500–2900 years for G292.0+1.8 (Camilo et al. 2002b; Temim et al. 2022) and 830–2500 years (Fesen et al. 2008; Kothes 2013) for 3C 58; both nebulae have high radio and X-ray luminosities (Zhu et al. 2018). However, a striking difference emerges at γ-ray energies: while both nebulae are detected in the GeV range, only 3C 58 is observed at TeV energies. One key factor that may contribute to this divergence is the interaction (or lack thereof) with the reverse shock in the host SNR. G292.0+1.8 is believed to have developed a reverse shock, although this remains debated Gaensler & Wallace (2003) suggested that the reverse shock has reached the PWN, citing the apparent lack of a clear spatial separation between the nebula and the SNR shell. Conversely, Bhalerao et al. (2015) argue that much of the ejecta remain unaffected by the reverse shock, implying that the PWN may still be in a pre-interaction stage. This uncertainty complicates the interpretation of the PWN's broadband emission and challenges the modeling of its evolution. In the case of 3C 58, it also remains unclear whether the PWN has been compressed by a reverse shock propagating back toward the pulsar. The question of whether such an interaction has occurred remains open, with resolution crucial to understanding the nebula's present state and long-term evolution. The PWN in G292.0+1.8 shares characteristics with that in SNR G54.1+0.3, particularly regarding the properties of their pulsars. Both pulsars have similar estimated ages (2000–2900 years for G54.1+0.3; Camilo et al. 2002b; Temim et al. 2022; Gelfand et al. 2015; Camilo et al. 2002a) and spin-down powers ( erg s-1; Camilo et al. 2002b,a). Additionally, both lie roughly 6 kpc away (Long et al. 2022; Leahy et al. 2008). Despite these similarities, G54.1+0.3 remains undetected in the GeV band, although its TeV emission is relatively strong. Broadband SED discrepancies in these three systems, despite similar pulsar characteristics, suggest that γ-ray emission in young PWNe is shaped not solely by intrinsic pulsar properties, but also by environmental factors. Such factors may include the density and spectrum of local photon fields, the strength and geometry of the magnetic field, and the ambient interstellar conditions within the host SNR. Such diversity can impact particle cooling, diffusion, and the efficiency of IC scattering, ultimately affecting whether a given PWN appears GeV -bright, TeV-bright, or both.
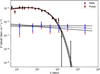 |
Fig. 6 Fermi-LAT spectrum of the new γ-ray PWN candidate associated with 4FGL J1124.7–5915/PSR J1124–5916, fitted simultaneously over the 50MeV-1TeV energy interval using the full dataset. The butterfly region denotes the 1σ confidence interval of the best-fit spectral model. Black and blue error bars indicate statistical uncertainties; red error bars correspond to the total uncertainties, combining statistical and systematic errors in quadrature. Systematic errors do not include uncertainties from possible source confusion. |
4.2 Broadband SED
Figure 7 presents the broadband SED of the PWN in G292.0+1.8, incorporating the radio data in this study (Sect. 2), X-ray measurements from Chandra (Hughes et al. 2001), LAT fluxes from our own analysis, and the TeV upper limit derived from H.E.S.S. observations (H. E. S. S. Collaboration 2018). The LAT flux uncertainties include both statistical and systematic contributions. A compact, torus-like structure surrounding PSR J1124–5916 has been detected in the optical and IR (Zharikov et al. 2008; Zyuzin et al. 2009); however, this feature is considerably smaller than the full extent of the radio and X-ray nebula and does not dominate the total PWN emission. For this reason, optical and IR data are not included in the SED.
To account for the broadband emission, we modeled the SED of G292.0+1.8 as a particle-dominated nebula powered by a singleelectron population. Using the Naima package (Zabalza 2015) we reproduced the nonthermal photon spectrum, assuming synchrotron radiation in a homogeneous and constant magnetic field, along with IC scattering of electrons interacting with ambient photon fields. These target fields include the cosmic microwave background (CMB), stellar light (characterized by an IR component at 26.5 K), and dust reemission in the NIR (at 2800 K).
Given the large Galactocentric distance of G292.0+1.8 ( R∼14.8kpc ), the local interstellar radiation field (ISRF) at z=0 is expected to be relatively weak. According to GAL-PROP simulations, typical ISRF values at this location are UFIR =0.2 eV cm-3 for the far infrared (FIR) component and UNIR =0.1 eV cm-3 for the NIR component (Strong et al. 2000; Shibata et al. 2011). However, several studies adopt enhanced ISRFs to fit PWN spectra, such as UFIR =0.42 eV cm-3 and UNIR = 0.7 eV cm-3 (Tanaka & Takahara 2013), or even UFIR = 1.0 eV cm-3 and UNIR = 0.7 eV cm-3 (Zhu et al. 2018). In our modeling, we considered two scenarios. Model 1 assumes a standard ISRF configuration with UFIR =0.2 eV cm-3 and UNIR = 0.1 eV cm-3, consistent with GALPROP predictions. Model 2 adopts an enhanced ISRF, with UFIR = 1.0 eV cm-3 and UNIR = 0.7 eV cm-3, to test the impact of elevated ambient photon densities on the IC emission component.
The synchrotron component of the SED is strongly constrained by the hard spectral index observed in the radio band. For a synchrotron radio spectrum with an index α ≃ –0.012, the corresponding power-law index of the injected electron spectrum index is γ1=1–2α ≃ 1.024 (with γ1 > 0). A comparison between the radio and X-ray bands indicates the presence of a spectral break that cannot be attributed solely to synchrotron cooling. This requires the introduction of an intrinsic cutoff in the electron injection spectrum at around Einjec,elec ≃ 40 GeV, beyond which the electron distribution steepens to γ2 ∼ 2.9. This behavior is similar to that observed in the PWN 3C 58 (Slane et al. 2008), as well as in other modeling studies (Zhu et al. 2018; Liu et al. 2024). The spectral break consistently occurs between the radio and X-ray bands, lying close to the infrared regime.
Additionally, the electron spectrum includes a second break at  TeV, resulting from synchrotron losses within the nebula. This high-energy cutoff is well constrained, appearing just below the X-ray band in the synchrotron emission and between the LAT spectrum and the very high energy (VHE) upper limits in the IC emission. The electron spectrum required to reproduce the SED is best described by a double broken power law with two energy breaks and three spectral indices (summarized in Table 4):

Notably, the relation γcool = γ2+1 and the cooling energy break location agree with a synchrotron-loss-dominated PWN in a homogeneous and constant magnetic field. In this case, the synchrotron cooling break energy (in eV ), for a PWN of age tage(yr) and magnetic field strength B (in G) is approximated as  (Slane et al. 2008). For a field strength of B≃15μG and a typical age of tage ∼ 2,5 kyr, the synchrotron break lies around 0.4 keV, corresponding to an electron break energy of
  . This estimate matches our Model 1 parameters and aligns with values from other models, such as Liu et al. (2024). However, reaching this cooling break energy magnitude is challenging with the higher magnetic field strength of Model 2.
The magnetic field strength near 15μG in Model 1 deviates from equipartition, yet it remains consistent with the age and size of the PWN, and lies within the range of values derived in previous PWN models. For comparison, Tanaka & Takahara (2013) estimated a field of B = 16 μG, while Martin et al. (2014) found a slightly higher value of B = 21 μG, the latter being closer to our Model 2. Comparable magnetic field values have also been inferred for the PWN 3C 58 (Slane et al. 2008; Tanaka & Takahara 2013), reinforcing the plausibility of our estimates.
The total energy contained in the electron population is estimated to be We(>2 GeV) = 5.3×1048 erg for Model 1 and We(>2 GeV)=2.2 × 1048 erg for Model 2. The very high rotational energy of PSR J1124–5916 is sufficient to account for the energetics of the nebula over its 2500-year lifetime.
Our modeling indicates that the emission can be consistently explained by a single electron population characterized by two spectral breaks. The first, located at energies of several tens of GeV, is likely intrinsic to the particle injection mechanism, while the second arises from synchrotron cooling in a magnetic field of ∼15 μG. This field strength, although far from equipartition, is similar to that inferred for the 3C 58 nebula. Given these similarities, including the spectral morphology and inferred magnetic conditions, we favor a scenario in which the reverse shock has not yet impacted the PWN in G292.0+1.8, analogous to the evolutionary state proposed for 3C 58.
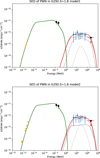 |
Fig. 7 Spectral energy distribution of the G292.0+1.8 PWN emission, fitted with the one-zone electron model described in Sect. 4. The dataset includes radio emission from Gaensler & Wallace (2003) and Sect. 2, the total PWN X-ray spectrum from Hughes et al. (2001), the VHE upper limit from (H. E. S. S. Collaboration 2018), and the Fermi-LAT spectrum obtained from our analysis. Two models, Model 1 and Model 2, fit the data; their parameters are summarized in Table 3. The inverse Compton (IC) emission (black line) accounts for contributions from the CMB (dashed line), starlight (dotted line), and dust (dotted-dashed line) targets, following the energy density estimates from Porter et al. (2006) and Shibata et al. (2011) for Model 1, and Zhu et al. (2018) for Model 2. |
Models parameters.
5 Summary
The limited number of PWNe firmly detected by Fermi-LAT underscores the pressing need for new identifications to better constrain their SEDs in the GeV domain. This task remains particularly challenging due to the overwhelming brightness of the associated pulsars, whose magnetospheric emission often outshines the comparatively fainter nebular component-potentially biasing the derived pulsar spectra if nebular contamination is neglected. As shown here, time-resolved (phase-resolved) γ-ray analysis is a powerful diagnostic tool for disentangling these components, even in cases where spatial separation is not feasible given the current angular resolution of γ-ray instruments.
This study yields several key results:
We report the first detection of GeV γ-ray emission potentially associated with the PWN in G292.0+1.8, successfully disentangling it from the bright pulsed emission of the nearby Fermi-LAT pulsar, 4FGL J1124–5916. This places G292.0+1.8 among the limited number of young pulsar-PWN systems for which the unpulsed nebular component has been spectrally isolated from the magnetospheric signal in the GeV regime.
We characterized the pulsed γ-ray spectra of the two main peaks (P1 and P2) of PSR J1124–5916, refining the under-standing of its magnetospheric emission.
We extracted and measured the spectrum of the unpulsed γ-ray component in the GeV band.
We constructed and modeled the broadband SED of the candidate PWN, combining the newly extracted γ-ray spectrum with radio and X-ray data. The emission is well described by a single electron population with two spectral breaks: an intrinsic injection break near tens of GeV and a synchrotron cooling break in a magnetic field of ∼15 μG. This relatively low magnetic field, significantly below equipartition, resembles that of 3C 58, supporting the notion that some young PWNe evolve in low-field environments.
The PWN in G292.0+1.8 exhibits a notably low TeV flux relative to its spin-down power, a feature it shares with 3C 58, contrasting with other young systems such as G54.1+0.3 that exhibit much stronger TeV emission. A precise characterization of the TeV spectrum is crucial to constrain the high-energy cutoff of the electron distribution and to verify the synchrotron cooling break inferred from our model. More broadly, the identification of GeV emission in the unpulsed component, which our Fermi-LAT analysis associates with the PWN in G292.0+1.8, expands the small sample of young systems in which such separation is achievable. This result provides valuable insights into the spectral diversity and evolutionary behavior of pulsars embedded in distinct environments. The ability to isolate and characterize both the pulsed and nebular components in a single PSR-PWN-SNR system such as G292.0+1.8 represents a significant advance for multiwavelength studies aimed at resolving the interplay between compact objects and their surrounding media.
Acknowledgements
This work and collaboration is supported by the International Emerging Actions program from CNRS (France). G.C. and N.M. are members of the Carrera del Investigador Científico (CONICET, Argentina). CONICET has partially supported this research (PIP 11220220100337). This paper used archived data obtained through the Galactic and Extragalactic All-sky Murchison Widefield Array, the CSIRO ASKAP Science Data Archive (CASDA), and the SARAO MeerKAT 1.3 GHz Galactic Plane Survey. The authors thank Maxime Regeard and Arache Djannati-Atai for fruitful discussions regarding pulsar observations with Fermi-LAT, which helped improve the quality of this work.
References
- Abdo, A. A., Ackermann, M., Ajello, M., et al. 2009, ApJ, 706, L1 [NASA ADS] [CrossRef] [Google Scholar]
- Abdo, A. A., Ackermann, M., Ajello, M., et al. 2010, ApJS, 187, 460 [Google Scholar]
- Abdo, A. A., Ajello, M., Allafort, A., et al. 2013, ApJS, 208, 17 [Google Scholar]
- Abdollahi, S., Acero, F., Baldini, L., et al. 2022, ApJS, 260, 53 [NASA ADS] [CrossRef] [Google Scholar]
- Acero, F., Ackermann, M., Ajello, M., et al. 2013, ApJ, 773, 77 [CrossRef] [Google Scholar]
- Ackermann, M., Ajello, M., Baldini, L., et al. 2011, ApJ, 726, 35 [Google Scholar]
- Ackermann, M., Ajello, M., Albert, A., et al. 2012a, ApJS, 203, 4 [Google Scholar]
- Ackermann, M., Ajello, M., Atwood, W. B., et al. 2012b, ApJ, 750, 3 [Google Scholar]
- Ajello, M., Atwood, W. B., Axelsson, M., et al. 2021, ApJS, 256, 12 [NASA ADS] [CrossRef] [Google Scholar]
- An, H. 2019, ApJ, 876, 150 [NASA ADS] [CrossRef] [Google Scholar]
- Atwood, W. B., Abdo, A. A., Ackermann, M., et al. 2009, ApJ, 697, 1071 [CrossRef] [Google Scholar]
- Atwood, W. B., Baldini, L., Bregeon, J., et al. 2013, ApJ, 774, 76 [Google Scholar]
- Ballet, J., Bruel, P., Burnett, T. H., Lott, B., & The Fermi-LAT collaboration. 2023, arXiv e-prints [arXiv:2307.12546] [Google Scholar]
- Bhalerao, J., Park, S., Dewey, D., et al. 2015, ApJ, 800, 65 [Google Scholar]
- Bhalerao, J., Park, S., Schenck, A., Post, S., & Hughes, J. P. 2019, ApJ, 872, 31 [Google Scholar]
- Camilo, F., Lorimer, D. R., Bhat, N. D. R., et al. 2002a, ApJ, 574, L71 [Google Scholar]
- Camilo, F., Manchester, R. N., Gaensler, B. M., Lorimer, D. R., & Sarkissian, J. 2002b, ApJ, 567, L71 [Google Scholar]
- Cotton, W. D., Kothes, R., Camilo, F., et al. 2024, ApJS, 270, 21 [NASA ADS] [CrossRef] [Google Scholar]
- de Jager, O. C., Ferreira, S. E. S., Djannati-Ataï, A., et al. 2009, Unidentified Gamma-Ray Sources as Ancient Pulsar Wind Nebulae [Google Scholar]
- Fesen, R., Rudie, G., Hurford, A., & Soto, A. 2008, ApJS, 174, 379 [Google Scholar]
- Gaensler, B. M., & Slane, P. O. 2006, ARA&A, 44, 17 [Google Scholar]
- Gaensler, B. M., & Wallace, B. J. 2003, ApJ, 594, 326 [NASA ADS] [CrossRef] [Google Scholar]
- Ge, M. Y., Yuan, J. P., Lu, F. J., et al. 2020, ApJ, 900, L7 [Google Scholar]
- Gelfand, J. D., Slane, P. O., & Temim, T. 2015, ApJ, 807, 30 [NASA ADS] [CrossRef] [Google Scholar]
- Grondin, M. H., Romani, R. W., Lemoine-Goumard, M., et al. 2013, ApJ, 774, 110 [Google Scholar]
- H. E. S. S. Collaboration (Abdalla, H., et al.) 2018, A&A, 612, A2 [NASA ADS] [CrossRef] [EDP Sciences] [Google Scholar]
- Hughes, J. P., Slane, P. O., Burrows, D. N., et al. 2001, ApJ, 559, L153 [Google Scholar]
- Hughes, J. P., Slane, P. O., Park, S., Roming, P. W. A., & Burrows, D. N. 2003, ApJ, 591, L139 [Google Scholar]
- Hurley-Walker, N., Callingham, J. R., Hancock, P. J., et al. 2017, MNRAS, 464, 1146 [Google Scholar]
- Kothes, R. 2013, ApJ, 765, 149 [NASA ADS] [CrossRef] [Google Scholar]
- Lange, A., Eagle, J., Kargaltsev, O., Kuiper, L., & Hare, J. 2025, ApJ, accepted [arXiv:2506.16687] [Google Scholar]
- Leahy, D. A., Tian, W., & Wang, Q. D. 2008, AJ, 136, 1477 [Google Scholar]
- Lee, H.-G., Koo, B.-C., Moon, D.-S., et al. 2009, ApJ, 706, 441 [Google Scholar]
- Lee, J.-J., Park, S., Hughes, J. P., et al. 2010, ApJ, 711, 861 [Google Scholar]
- Liu, Y.-M., Zeng, H.-D., Xin, Y.-L., Liu, S.-M., & Zhang, Y. 2024, Res. Astron. Astrophys., 24, 075016 [Google Scholar]
- Long, X., Patnaude, D. J., Plucinsky, P. P., & Gaetz, T. J. 2022, ApJ, 936, 24 [NASA ADS] [CrossRef] [Google Scholar]
- Martin, J., Torres, D. F., Cillis, A., & de Oña Wilhelmi, E. 2014, MNRAS, 443, 138 [NASA ADS] [CrossRef] [Google Scholar]
- Mattana, F., Falanga, M., Götz, D., et al. 2009, ApJ, 694, 12 [Google Scholar]
- McConnell, D., Hale, C. L., Lenc, E., et al. 2020, PASA, 37, e048 [Google Scholar]
- Park, S., Hughes, J. P., Slane, P. O., et al. 2007, ApJ, 670, L121 [NASA ADS] [CrossRef] [Google Scholar]
- Perley, R. A., & Butler, B. J. 2017, ApJS, 230, 7 [NASA ADS] [CrossRef] [Google Scholar]
- Porter, T. A., Moskalenko, I. V., & Strong, A. W. 2006, ApJ, 648, L29 [CrossRef] [Google Scholar]
- Rousseau, R., Grondin, M. H., Van Etten, A., et al. 2012, A&A, 544, A3 [NASA ADS] [CrossRef] [EDP Sciences] [Google Scholar]
- Rudie, G. C., Hester, J. J., & Allen, G. E. 2007, ApJ, 661, 417 [Google Scholar]
- Safi-Harb, S., & Gonzalez, M. E. 2002, ASP Conf. Ser., 262, 315 [Google Scholar]
- Shibata, T., Ishikawa, T., & Sekiguchi, S. 2011, ApJ, 727, 38 [NASA ADS] [CrossRef] [Google Scholar]
- Slane, P., Helfand, D. J., Reynolds, S. P., et al. 2008, ApJ, 676, L33 [NASA ADS] [CrossRef] [Google Scholar]
- Smith, D. A., Abdollahi, S., Ajello, M., et al. 2023, ApJ, 958, 191 [NASA ADS] [CrossRef] [Google Scholar]
- Strong, A. W., Moskalenko, I. V., & Reimer, O. 2000, ApJ, 537, 763 [NASA ADS] [CrossRef] [Google Scholar]
- Swartz, D. A., Pavlov, G. G., Clarke, T., et al. 2015, ApJ, 808, 84 [NASA ADS] [CrossRef] [Google Scholar]
- Tanaka, S. J., & Takahara, F. 2013, MNRAS, 429, 2945 [CrossRef] [Google Scholar]
- Temim, T., Slane, P., Raymond, J. C., et al. 2022, ApJ, 932, 26 [Google Scholar]
- Winkler, P. F., Twelker, K., Reith, C. N., & Long, K. S. 2009, ApJ, 692, 1489 [Google Scholar]
- Wood, M., Caputo, R., Charles, E., et al. 2021, Int. Cosmic Ray Conf., 301, 824 [NASA ADS] [Google Scholar]
- Zabalza, V. 2015, Int. Cosmic Ray Conf., 34, 922 [Google Scholar]
- Zharikov, S. V., Shibanov, Y. A., Zyuzin, D. A., Mennickent, R. E., & Komarova, V. N. 2008, A&A, 492, 805 [NASA ADS] [CrossRef] [EDP Sciences] [Google Scholar]
- Zharikov, S. V., Zyuzin, D. A., Shibanov, Y. A., & Mennickent, R. E. 2013, A&A, 554, A120 [NASA ADS] [CrossRef] [EDP Sciences] [Google Scholar]
- Zhu, B.-T., Zhang, L., & Fang, J. 2018, A&A, 609, A110 [NASA ADS] [CrossRef] [EDP Sciences] [Google Scholar]
- Zyuzin, D. A., Danilenko, A. A., Zharikov, S. V., & Shibanov, Y. A. 2009, A&A, 508, 855 [NASA ADS] [CrossRef] [EDP Sciences] [Google Scholar]
We note that Cotton et al. (2024) report a flux density of 5.8 ± 0.4 Jy from the same MeerKAT image used here. Our independent measurement (see Table 1) is fully consistent with this result, and we adopt it for the spectral analysis.
A similar procedure was applied to the PWN in IC 443; Swartz et al. (2015).
All Tables
Fermi-LAT morphological parameters for the new PWN candidate associated with PSR J1124–5916.
All Figures
|
Fig. 1 Left: radio image of SNR G292.0+1.8 from the Rapid ASKAP Continuum Survey at 887.5 MHz , showing the full extent of the remnant. The color scale (square-root scale, in units of Jy beam-1 is adjusted to enhance the visibility of the shell structure; consequently, the central PWN appears saturated. A zoom-in on the PWN is shown in the inset, where the square-root color scale ranges from 0.015 to 0.4 Jy beam-1 and is optimized to highlight the internal PWN morphology. The contours in the inset are drawn at 0.07, 0.13, 0.18, and 0.3 Jy beam-1 and are shown for reference to delineate internal structures. The yellow cross marks the position of the PSR J1124–5916. The synthesized beam is 25''×25'', and the rms noise level is 0.5 mJy beam-1. Right: updated radio continuum spectrum of the PWN associated with PSR J1124-5916 within SNR G292.0+1.8. Green diamonds correspond to the new flux density measurements obtained in this work from radio surveys, whereas orange symbols represent values compiled from the literature (see Table 1). The solid line indicates the best fit to the weighted data, yielding a radio spectral index of α=-0.012 ± 0.010. The shaded gray and light blue bands denote the 1σ and 2σ statistical uncertainties in the best-fit α value, respectively. |
| In the text | |
|
Fig. 2 Phase profile constructed using photons with energies above 50 MeV within a region of 0.2 around PSR J1124–5916. The profile spans one full rotation, divided into 100 bins. The two dashed and solid vertical lines represent the off-pulse and on-pulse windows, respectively, as defined in the text and used in the phase-resolved analysis. |
| In the text | |
|
Fig. 3 Fermi-LAT TS map of the region surrounding PSR J1124–5916 for energies above 1 GeV in Galactic coordinates during the OFF-pulse phase interval. All sources in the 4FGL-DR3 catalog were included, except the pulsar source 4FGL J1124.7–5915, which was removed from the model. The color bar indicates the TS value range. The white star marks the position of PSR J1124-5916. The dash-dot black circle represents the 1σ error radius for the best-fit position obtained in the off-pulse phase interval analysis, while the dashed black circle indicates the 95% confidence level upper limit on the source extension. Light blue contours show radio data from the Molonglo Observatory Synthesis Telescope (MOST), highlighting the extent of the radio PWN; the green circle corresponds to the X-ray PWN extension detected by Chandra (Hughes et al. 2003), and the red circle indicates the SNR G292.0+1.8 extension. |
| In the text | |
|
Fig. 4 Fermi-LAT γ-ray spectra of the pulsar PSR J1124–5916 (4FGL J1124.7-5915) for the pulsed P1 peak (black dots) and pulsed P2 peak (blues squares) phase intervals. The solid black and dashed blue curves represent the best-fit sub-exponentially cutoff power-law models for the P2 and P1 phase intervals, respectively, over the 50 MeV–300 GeV energy range. The model shape follows that used for significantly curved pulsars in the 4FGL-DR3 catalog. The red error bars include both statistical and systematic uncertainties, with the latter primarily arising from the Galactic diffuse emission model and the IRFs at low energy. The butterfly region denotes the 1σ confidence interval of the best-fit spectral model. |
| In the text | |
|
Fig. 5 Zoomed-in views of the >1 GeV Fermi-LAT total dataset TS maps in a 2°×2° region centered on 4FGL J1124.7–5915. Left: residual TS map with all 4FGL-DR3 sources except PSR J1124-5916 / 4FGL J1124.7–5915 and the newly detected source. The map highlights the pulsar emission. Middle: residual TS map with all 4FGL-DR3 sources, including 4FGL J1124.7-5915, with best-fit parameters derived from the likelihood analysis. The map highlights the excess emission associated with the newly detected source corresponding to the PWN hosted in SNR G292.0+1.8. The dash-dotted black circle indicates the best-fit position of the new source, with the radius corresponding to the 68% confidence positional uncertainty. The 95% confidence upper limit on the source extension is shown by a larger dash-dotted black circle. The position of PSR J1124–5916 / 4FGL J1124.7–5915 is marked with a white star. Radio contours are overlaid in cyan; the green circle corresponds to the X-ray PWN extension detected by Chandra (Hughes et al. 2003), and the red circle indicates the SNR G292.0+1.8 extension. Right: residual TS map for the complete source model, including all 4FGL-DR3 sources, PSR J1124–5916/4FGL J1124.7–5915, and the newly detected source, demonstrating that the emission is well accounted for. |
| In the text | |
|
Fig. 6 Fermi-LAT spectrum of the new γ-ray PWN candidate associated with 4FGL J1124.7–5915/PSR J1124–5916, fitted simultaneously over the 50MeV-1TeV energy interval using the full dataset. The butterfly region denotes the 1σ confidence interval of the best-fit spectral model. Black and blue error bars indicate statistical uncertainties; red error bars correspond to the total uncertainties, combining statistical and systematic errors in quadrature. Systematic errors do not include uncertainties from possible source confusion. |
| In the text | |
|
Fig. 7 Spectral energy distribution of the G292.0+1.8 PWN emission, fitted with the one-zone electron model described in Sect. 4. The dataset includes radio emission from Gaensler & Wallace (2003) and Sect. 2, the total PWN X-ray spectrum from Hughes et al. (2001), the VHE upper limit from (H. E. S. S. Collaboration 2018), and the Fermi-LAT spectrum obtained from our analysis. Two models, Model 1 and Model 2, fit the data; their parameters are summarized in Table 3. The inverse Compton (IC) emission (black line) accounts for contributions from the CMB (dashed line), starlight (dotted line), and dust (dotted-dashed line) targets, following the energy density estimates from Porter et al. (2006) and Shibata et al. (2011) for Model 1, and Zhu et al. (2018) for Model 2. |
| In the text | |
Current usage metrics show cumulative count of Article Views (full-text article views including HTML views, PDF and ePub downloads, according to the available data) and Abstracts Views on Vision4Press platform.
Data correspond to usage on the plateform after 2015. The current usage metrics is available 48-96 hours after online publication and is updated daily on week days.
Initial download of the metrics may take a while.