Fig. 5
Download original image
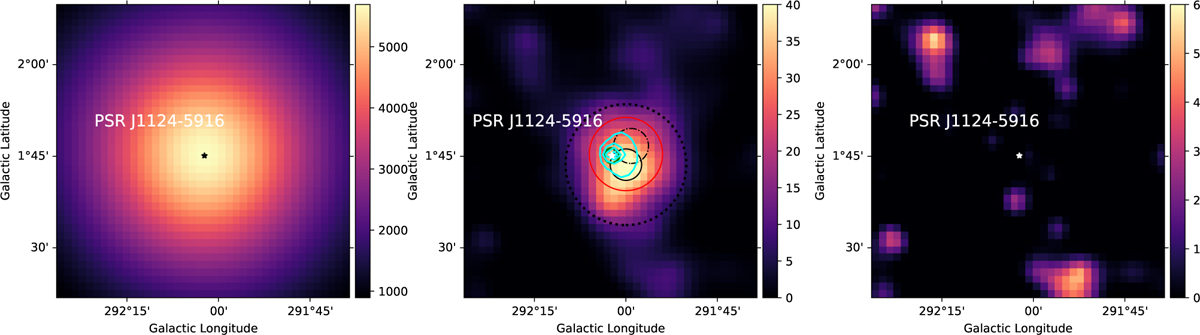
Zoomed-in views of the >1 GeV Fermi-LAT total dataset TS maps in a 2°×2° region centered on 4FGL J1124.7–5915. Left: residual TS map with all 4FGL-DR3 sources except PSR J1124-5916 / 4FGL J1124.7–5915 and the newly detected source. The map highlights the pulsar emission. Middle: residual TS map with all 4FGL-DR3 sources, including 4FGL J1124.7-5915, with best-fit parameters derived from the likelihood analysis. The map highlights the excess emission associated with the newly detected source corresponding to the PWN hosted in SNR G292.0+1.8. The dash-dotted black circle indicates the best-fit position of the new source, with the radius corresponding to the 68% confidence positional uncertainty. The 95% confidence upper limit on the source extension is shown by a larger dash-dotted black circle. The position of PSR J1124–5916 / 4FGL J1124.7–5915 is marked with a white star. Radio contours are overlaid in cyan; the green circle corresponds to the X-ray PWN extension detected by Chandra (Hughes et al. 2003), and the red circle indicates the SNR G292.0+1.8 extension. Right: residual TS map for the complete source model, including all 4FGL-DR3 sources, PSR J1124–5916/4FGL J1124.7–5915, and the newly detected source, demonstrating that the emission is well accounted for.
Current usage metrics show cumulative count of Article Views (full-text article views including HTML views, PDF and ePub downloads, according to the available data) and Abstracts Views on Vision4Press platform.
Data correspond to usage on the plateform after 2015. The current usage metrics is available 48-96 hours after online publication and is updated daily on week days.
Initial download of the metrics may take a while.