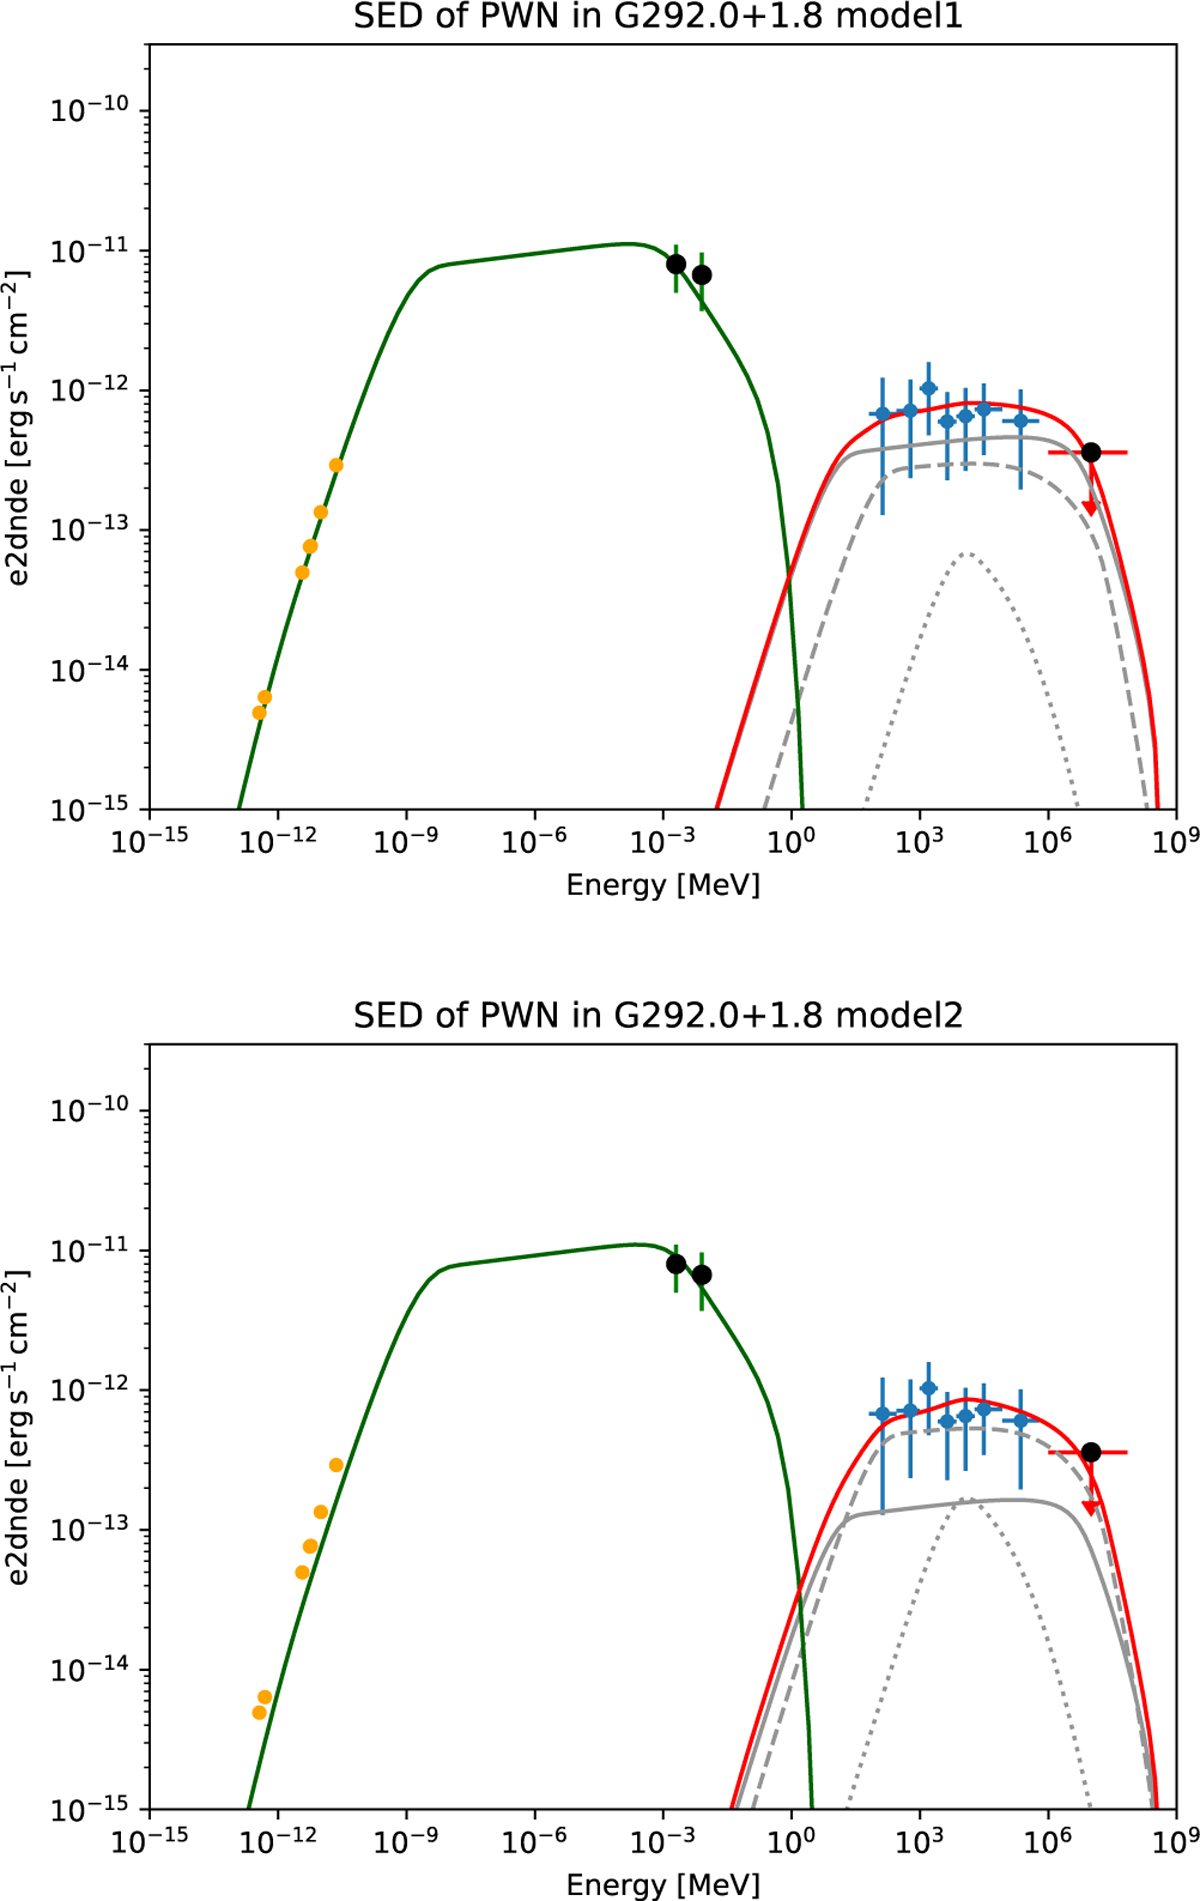
Fig. 7
Download original image
Spectral energy distribution of the G292.0+1.8 PWN emission, fitted with the one-zone electron model described in Sect. 4. The dataset includes radio emission from Gaensler & Wallace (2003) and Sect. 2, the total PWN X-ray spectrum from Hughes et al. (2001), the VHE upper limit from (H. E. S. S. Collaboration 2018), and the Fermi-LAT spectrum obtained from our analysis. Two models, Model 1 and Model 2, fit the data; their parameters are summarized in Table 3. The inverse Compton (IC) emission (black line) accounts for contributions from the CMB (dashed line), starlight (dotted line), and dust (dotted-dashed line) targets, following the energy density estimates from Porter et al. (2006) and Shibata et al. (2011) for Model 1, and Zhu et al. (2018) for Model 2.
Current usage metrics show cumulative count of Article Views (full-text article views including HTML views, PDF and ePub downloads, according to the available data) and Abstracts Views on Vision4Press platform.
Data correspond to usage on the plateform after 2015. The current usage metrics is available 48-96 hours after online publication and is updated daily on week days.
Initial download of the metrics may take a while.