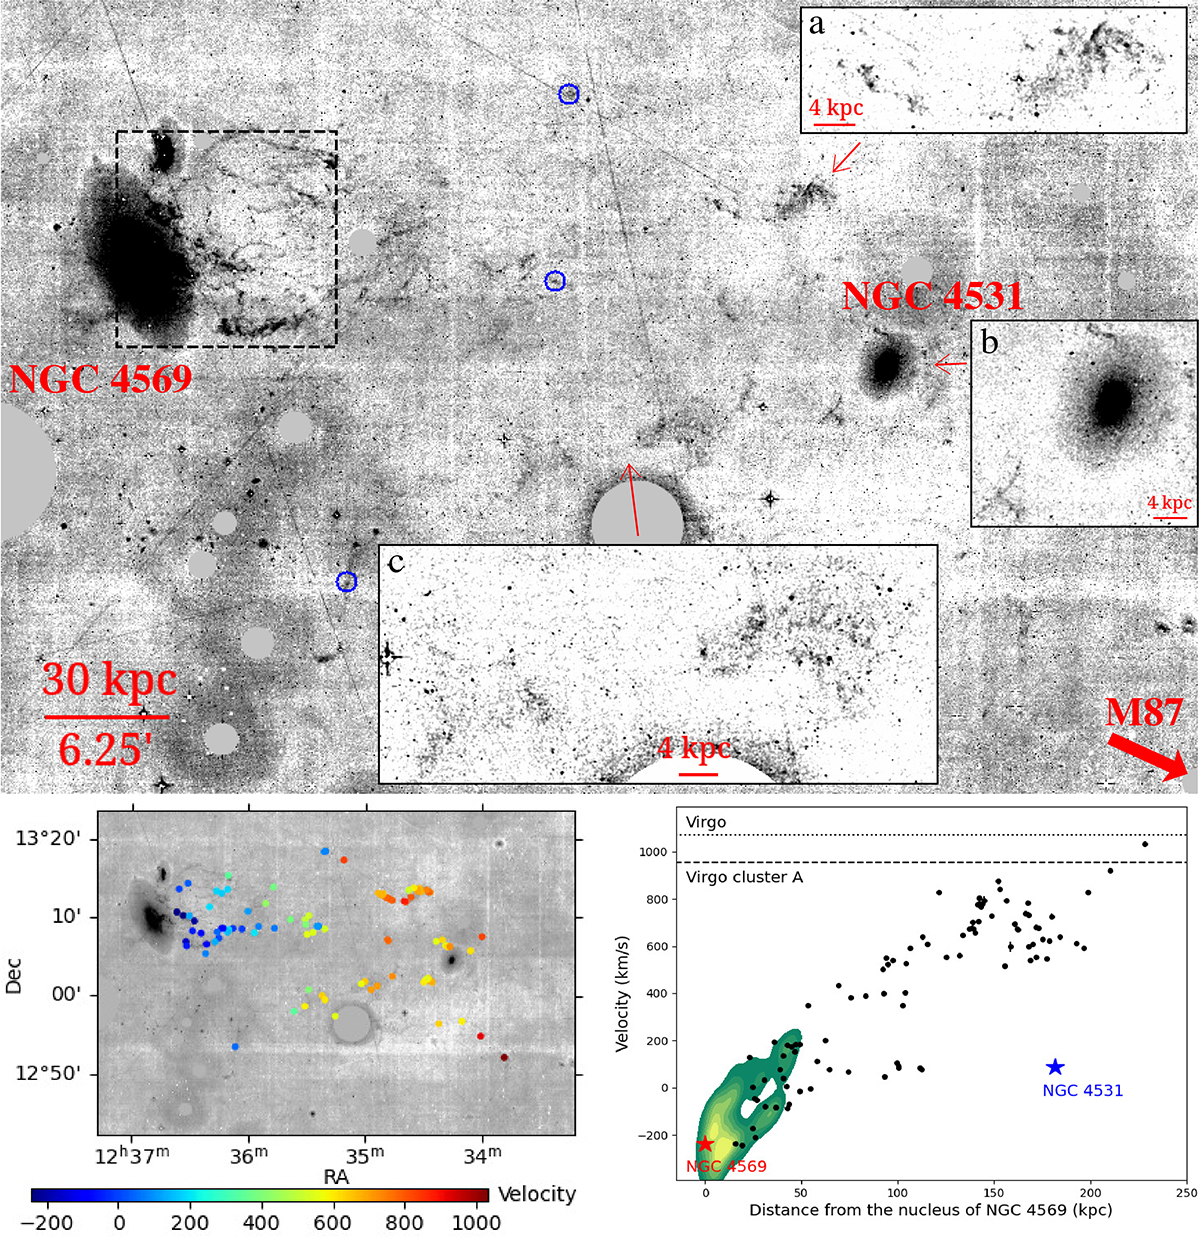
Fig. 1.
Download original image
Top: Net Hα image showing the extended optical emission-line clumps/filaments trailing NGC 4569. Bright stars and their scattered halos are masked. The black box in the dashed line is the SITELLE field shown in Fig. 3. Three zoom-ins are also shown. The direction toward M87 is also shown at the lower right corner. Note: the clumps and filaments around NGC 4531 have very different velocities from NGC 4531. Because of the various instrumental artifacts, spectroscopic follow-ups are required. Bottom-left: Same net Hα image as the one shown in the upper panel, with velocities of 94 clumps from Binospec overlaid. See Fig. 3 for velocities at the front part of the tail from SITELLE. Bottom-right: Velocities (with a 1σ uncertainty) of 94 clumps from Binospec in black, along with the kernel density estimation (KDE) of the SITELLE velocities (as shown in Fig. 3) versus distance from the nucleus of NGC 4569. The KDE shows the probability density function of the SITELLE velocities, with yellow as the highest density. For reference, NGC 4569 is at –235 km s−1 and NGC 4531 is at 90 km s−1. The velocity of the Virgo cluster A is 955 km s−1 from Boselli et al. (2014), while Kashibadze et al. (2020) gave a velocity of 1070 km s−1 for the Virgo cluster. The observed clumps show a smooth velocity gradient from NGC 4569 and there is no evidence for their connection with NGC 4531. The end of the detected Hα tail is nearly at rest (along the line of sight) with respect to the Virgo cluster mean velocity. There are a few clumps at distance ∼100 kpc with velocities of 50–100 km s−1. They are in three groups and marked in small blue circles in the top panel. Despite their similar velocities to those seen for NGC 4531, there is no spatial evidence to suggest a connection.
Current usage metrics show cumulative count of Article Views (full-text article views including HTML views, PDF and ePub downloads, according to the available data) and Abstracts Views on Vision4Press platform.
Data correspond to usage on the plateform after 2015. The current usage metrics is available 48-96 hours after online publication and is updated daily on week days.
Initial download of the metrics may take a while.