| Issue |
A&A
Volume 705, January 2026
|
|
|---|---|---|
| Article Number | A139 | |
| Number of page(s) | 7 | |
| Section | Extragalactic astronomy | |
| DOI | https://doi.org/10.1051/0004-6361/202556225 | |
| Published online | 13 January 2026 | |
A Virgo Environmental Survey Tracing Ionised Gas Emission (VESTIGE)
XIX. The discovery of a spectacular 230 kpc Hα tail following NGC 4569 in the Virgo cluster
1
Department of Physics & Astronomy, University of Alabama in Huntsville 301 Sparkman Dr NW Huntsville AL 35899, USA
2
Aix Marseille Université, CNRS, LAM (Laboratoire d’Astrophysique de Marseille) UMR 7326 13388 Marseille, France
3
Canada-France-Hawaii Telescope 65-1238 Mamalahoa Highway Kamuela HI 96743, USA
4
INAF – Osservatorio Astronomico di Cagliari Via della Scienza 5 09047 Selargius (CA), Italy
5
School of Physics and Electronic Science, Guizhou Normal University, Guiyang 550001, PR China; Guizhou Provincial Key Laboratory of Radio Astronomy and Data Processing, Guizhou Normal University Guiyang 550001, PR China
6
Center for Astrophysics | Harvard & Smithsonian 60 Garden St. Cambridge MA 02138, USA
7
Department of Astronomy and Virginia Institute for Theoretical Astronomy, University of Virginia P.O. Box 400325 Charlottesville VA 22904, USA
8
Dipartimento di Fisica G. Occhialini, Università degli Studi di Milano Bicocca Piazza della Scienza 3 I-20126 Milano, Italy
9
INAF-Osservatorio Astronomico di Brera via Brera 28 I-20121 Milano, Italy
10
Research Center for Astronomical Computing, Zhejiang Laboratory Hangzhou 311100, PR China
11
Department of Astrophysics, University of Vienna Türkenschanzstrasse 17 1180 Vienna, Austria
12
SISSA – International School for Advanced Studies Via Bonomea 265 34136 Trieste, Italy
13
Laboratoire d’Astrophysique de Bordeaux, Univ. Bordeaux, CNRS, B18N, allée Geoffroy Saint-Hilaire 33615 Pessac, France
14
AIM, CEA, CNRS, Université Paris-Saclay, Université Paris Diderot, Sorbonne Paris Cité, Observatoire de Paris, PSL University F-91191 Gif-sur-Yvette Cedex, France
15
National Research Council of Canada, Herzberg Astronomy and Astrophysics 5071 West Saanich Road Victoria BC V9E 2E7, Canada
16
Université de Strasbourg, CNRS, Observatoire astronomique de Strasbourg, UMR 7550 67000 Strasbourg, France
★ Corresponding author: This email address is being protected from spambots. You need JavaScript enabled to view it.
Received:
3
July
2025
Accepted:
30
November
2025
Abstract
Context. Galaxies fly inside galaxy clusters and ram pressure by the intracluster medium (ICM) can remove a large amount of the interstellar medium (ISM) from the galaxy, and deposit the gas in the ICM. The ISM decoupled from the host galaxy leaves a long trail following the moving galaxy. Such long trails track galaxy motions and they can be detected with sensitive data in Hα.
Aims. We study the Hα tail trailing NGC 4569 in the Virgo cluster.
Methods. The initial discovery was made with the deep Hα imaging data with CFHT from the VESTIGE project. The follow-up spectroscopic observations were carried out with APO/DIS, MMT/Binospec, and CFHT/SITELLE.
Results. Aside from the known 80 kpc Hα tail downstream of NGC 4569, the deep Hα imaging data allow the Hα tail detected to at least 230 kpc from the galaxy. More importantly, we confirmed the Hα clumps implied from the imaging data with spectroscopic data. The Hα clumps show a smooth radial velocity gradient across ∼1300 km/s, eventually reaching the velocity of the cluster.
Conclusions. For the first time, this discovery offers a view of the full deceleration process of the stripped ISM. This discovery also showcases the potential with wide-field Hα survey on galaxy clusters to discover intracluster optical emission-line clouds originated from cluster galaxies. These clouds provide kinematic tracers to the infall history of cluster galaxies and the turbulence in the ICM. They also serve as excellent multi-phase objects for studying the classical cloud-crushing problem and other important physical processes.
Key words: galaxies: clusters: general / galaxies: clusters: intracluster medium / galaxies: evolution / galaxies: ISM / galaxies: clusters: individual: Virgo / galaxies: individual: NGC 4569
© The Authors 2026
 Open Access article, published by EDP Sciences, under the terms of the Creative Commons Attribution License (https://creativecommons.org/licenses/by/4.0), which permits unrestricted use, distribution, and reproduction in any medium, provided the original work is properly cited.
This article is published in open access under the Subscribe to Open model. This email address is being protected from spambots. You need JavaScript enabled to view it. to support open access publication.
1. Introduction
Most baryons in galaxy clusters are in the hot (T ∼ 107 − 108 K) ICM that permeates the space between galaxies. As cluster galaxies soar through the ICM, the interaction with the ICM plays a vital role in galaxy evolution, through ram pressure stripping (RPS) of the ISM (e.g., Boselli et al. 2022). The ISM, removed from the galaxy by RPS, forms tails downstream of the moving galaxy. Stripped tails have been detected and studied in CO, radio continuum, H I, Hα, and X-rays (see the recent summary in Boselli et al. 2022). Tails vary in surface brightness, typically with bright clumps and filaments embedded in a more diffuse, uniform component. Star formation (SF) activity also varies in tails with the SF conditions in tails not well understood. So far, one of the best probes on stripped tails is Hα, with a large covering fraction, good sensitivity, and high angular resolution together (e.g., Gavazzi et al. 2001; Yagi et al. 2010; Poggianti et al. 2017), while the data at some other bands either lack sensitivity and angular resolution (e.g., H I, X-rays), or have a small covering fraction (e.g., CO).
Stripped tails can trace the infall history of cluster galaxies, especially if they can be detected far from the galaxy. On the other hand, stripped ISM is subject to cluster “weather”, so their studies can provide constraints on the ICM turbulence. Thus, long stripped tails serve as valuable laboratories. However, nearly all stripped tails have projected lengths below ∼100 kpc (see summary in Boselli et al. 2022). In this paper, we present the discovery of a 230 kpc long Hα tail following NGC 4569 in the Virgo cluster, also with the kinematic confirmation to recover the deceleration history of the stripped ISM. NGC 4569 is one of the largest and most massive spirals in the Virgo cluster. It has a remarkably high velocity with respect to the Virgo cluster with a radial velocity of –235 km s−1 (de Vaucouleurs et al. 1991). Kashibadze et al. (2020) gave a velocity of 1070 km s −1 for the Virgo cluster, while the velocity of M87 is 1284 km/s (Cappellari et al. 2011). Thus, NGC 4569’s relative velocity along the line of sight is ∼1300 km/s, while its long Hα and X-ray tails (Boselli et al. 2016; Sun et al. 2021; and this work) also show a significant velocity component in the plane of sky. NGC 4569 has lost over 90% of its initial H I gas (e.g., Cayatte et al. 1990; Vollmer et al. 2004). It has a truncated disk observed in CO, HI, Hα and dust and shows the impact of RPS for several hundred megayears (Myr; e.g., Boselli et al. 2006, 2016). An ionized gas tail was revealed out to ∼80 kpc (projected) from the galaxy (Boselli et al. 2016), which motivated the Virgo Environmental Survey Tracing Ionised Gas Emission (VESTIGE) (Boselli et al. 2018). With the deeper VESTIGE data, this paper presents the discovery of an even longer Hα tail trailing NGC 4569. More importantly, the follow-up optical spectroscopic data confirm the association of many clumps and filaments in the tail with NGC 4569 and also show a coherent velocity gradient as these stripped clumps are decelerated by ram pressure. This paper presents the initial discovery and the velocity confirmation. More detailed studies on the ionized gas clumps (e.g., line ratios, local kinematics, velocity dispersion, velocity structure function) with the Binospec and MUSE data will be presented in a future paper. We adopted a distance of 16.5 Mpc to the Virgo cluster (Mei et al. 2007). Therefore, 1′ = 4.80 kpc.
2. VESTIGE data and the long Hα tail trailing NGC 4569
Boselli et al. (2016) presented results based on 1.28 hours of narrow-band imaging data with CFHT/MegaCam, centered around the near tail region of NGC 4569. VESTIGE adds 2 hours of narrow-band imaging data, allowing it to cover a much wider field around NGC 4569 (Boselli et al. 2018). The deeper Hα + [N II] data and the wider coverage allow the detection of the longer extension to over ∼200 kpc from NGC 4569 (Fig. 1). The Hα tail is composed of many filaments and clumps, but lacking bright, compact regions, such as H II regions. The average distance between clumps and filaments also increases beyond the initial 80 kpc tail. There is no detected diffuse Hα component with a high covering fraction to connect clumps and filaments. However, such a diffuse, low-surface-brightness tail would be difficult to detect robustly with all the image artifacts; for instance, scattered light around bright stars, increased noise along the chip gaps, and the flat-field uncertainty at large scales. Because of all the artifacts (evident in Fig. 1), spectroscopic observations are required to confirm the existence of these emission-line features and their association with NGC 4569, as discussed in the following sections.
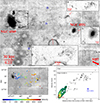 |
Fig. 1. Top: Net Hα image showing the extended optical emission-line clumps/filaments trailing NGC 4569. Bright stars and their scattered halos are masked. The black box in the dashed line is the SITELLE field shown in Fig. 3. Three zoom-ins are also shown. The direction toward M87 is also shown at the lower right corner. Note: the clumps and filaments around NGC 4531 have very different velocities from NGC 4531. Because of the various instrumental artifacts, spectroscopic follow-ups are required. Bottom-left: Same net Hα image as the one shown in the upper panel, with velocities of 94 clumps from Binospec overlaid. See Fig. 3 for velocities at the front part of the tail from SITELLE. Bottom-right: Velocities (with a 1σ uncertainty) of 94 clumps from Binospec in black, along with the kernel density estimation (KDE) of the SITELLE velocities (as shown in Fig. 3) versus distance from the nucleus of NGC 4569. The KDE shows the probability density function of the SITELLE velocities, with yellow as the highest density. For reference, NGC 4569 is at –235 km s−1 and NGC 4531 is at 90 km s−1. The velocity of the Virgo cluster A is 955 km s−1 from Boselli et al. (2014), while Kashibadze et al. (2020) gave a velocity of 1070 km s−1 for the Virgo cluster. The observed clumps show a smooth velocity gradient from NGC 4569 and there is no evidence for their connection with NGC 4531. The end of the detected Hα tail is nearly at rest (along the line of sight) with respect to the Virgo cluster mean velocity. There are a few clumps at distance ∼100 kpc with velocities of 50–100 km s−1. They are in three groups and marked in small blue circles in the top panel. Despite their similar velocities to those seen for NGC 4531, there is no spatial evidence to suggest a connection. |
3. Binospec data and analysis
We conducted spectroscopic observations of emission-line objects trailing NGC 4569 with the Binospec spectrograph on the MMT telescope (Table 1). Binospec is a multislit imaging spectrograph with wide wavelength coverage and high efficiency (Fabricant et al. 2019). It has two sides, each with a field of view of 8′×15′ separated by a gap of 3.2′. Each side is covered by a sheet metal slit mask that can hold over 150 slitlets, parallel to the long side of the mask. We used the 600 lines/mm grating. The wavelength coverage varies across the field but is typically ∼4900 Å to 7200 Å, with a 0.62 Å/pixel dispersion and ∼2800 resolving power for 1″ slits. The Binospec data were reduced with the Binospec pipeline1. As our targets are diffuse clouds that can fill individual slitlets, we did not use the automatic spectrum extraction in the pipeline. Instead, the 2D spectrum of each slit was examined to identify the regions of interest for extraction, also with the help of the VESTIGE imaging data. The spatial dimension of the spectral extraction regions ranges from 2.9″ to 18.2″, with a median length of 6.7″ (or 0.54 kpc).
Binospec/MMT observations.
We then used our own python code to extract one-dimensional (1D) spectra from the two-dimensional (2D) spectra and fit spectra to obtain barycentric velocities and line ratios. The fit was done with five Gaussian functions with the same velocity to model the Hα, [N II], and [S II] lines, plus a continuum model. [N II] λ 6584 and [N II] λ 6548 is fixed at 3. While the Hβ and [O III] wavelengths are covered by about half of the data, there are only a few robust detections. LMFIT2 was used for the nonlinear least-squares minimization and the fitting methods are dual annealing and Levenberg-Marquardt. Examples of four spectra are shown in Fig. 2. We also verified our velocity results by running RVSAO on a small subsample and found consistent velocity measurements. In total, we obtained robust velocities for 94 emission-line objects, all with velocities consistent with the objects in the Virgo cluster (Fig. 1). The median velocity statistical error is 5 km s−1, while the velocity systematic uncertainty is 6–10 km s−1. There are 137 slits in total for candidate Hα clouds. The success rate, defined as the fraction of slits with derived velocities consistent with that of the Virgo cluster, is ∼2/3. Seventeen slits have weak line signals that are below our detection threshold (> 3σ for at least two lines). When excluding the shallow field1 data, the success rate is ∼80%, demonstrating the robustness of the VESTIGE Hα imaging data, even near the detection threshold. We have also obtained VLT/MUSE data in three fields at 60, 171, and 210 kpc from the nucleus (program: 111.259P; PI: Sun). There are five velocities measured from Binospec in these three MUSE fields and those velocity values are confirmed by the MUSE data, as well as the line ratios. Results from the MUSE data will be presented in a future paper. The MW extinction has been corrected with the Fitzpatrick (1999) extinction law, with AV = 0.13 mag and RV = 3.1.
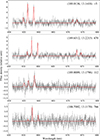 |
Fig. 2. Binospec spectra on four slit positions, from one of the brightest regions in the top, a region with median brightness in the row 2, to two spectra with about the least significant detections in our sample. Our best-fit model is shown in the red line. Only the portion around [N II], Hα, and [S II] is shown. The shown spectra are unbinned on the spectral axis with a 0.62 Å sampling. The central coordinate of each position (in brackets) and the best-fit velocity are shown in the top-right corner. |
4. APO data and analysis
While most the spectroscopic results in this work come from Binospec, the spectroscopic follow-up started with the Dual Imaging Spectrograph (DIS) on the Apache Point Observatory (APO) in 2021 (PI: Sarazin/Sun). On Jan. 16 and Feb. 4, 2021, we observed a cloud at (RA, Dec) = (12:34:31.7, +13:13:46) for 6 × 10 min with a 2″ slit and 12 × 10 min with a 5″ slit, respectively. [N II], [S II], and Hα lines at a velocity of ∼650 km s−1 were clearly detected. As this region was later well covered by Binospec with ∼3× depth, we do not include the DIS results in the velocity analysis. The DIS spectra were used to independently verify the Binospec velocities in the same region, as well as the line ratios. More importantly, this initial confirmation helped to justify the later Binospec observations.
5. SITELLE data and analysis
SITELLE is an imaging Fourier Transform Spectrometer (iFTS) that produces spectra for any 0.32″ × 0.32″ pixels within its 11′ × 11′ field of view (Drissen et al. 2019). It was used on February 9–11, 2024 to observe NGC 4569 and its tail with a 12.3 nm wide (at 90% transmission) filter SN4 specifically designed to allow the detection of diffuse Hα emission down to 5 × 10⁻¹⁸ erg s−1 cm−2 arcsec−2 after a 16 × 16 pixels (5″ × 5″) binning in about 5 hours of on-source exposures (commissioning data). The field is shown in Fig. 1. The spectral resolution was set to R = 4000, using 375 scanning steps of 50 sec on-source exposure each. The sky conditions were clear with 0.8″ − −1.5″ seeing.
The data were reduced using the standard ORB/ORBS software used at CFHT (Martin et al. 2015). A dedicated analysis was performed to remove sky lines prior to further analysis. Median sky spectra computed over extended areas were removed for each pixels. The velocity variations across the tails ensures that the associated emission lines are not present in the median sky spectra. The data were also calibrated in wavelength using the OH night sky lines to provide accurate barycentric velocity measurements, reaching ∼10 − 40 km s−1 in accuracy, depending on the line intensities.
To enhance the signal on faint extended regions, the data cube was smoothed using a 32-pixel FWHM Gaussian kernel and binned by a factor of 16. It was also spectrally smoothed with a 2-pixel FWHM Gaussian kernel before analysis. The emission line analysis was performed using a version of the Camel software3 (Epinat et al. 2012) modified to work with iFTS data cubes in wavenumber rather than in wavelength. Both Hα and [N II]λ6584 lines were simultaneously fitted ([N II]λ6548 not covered). The velocity map is shown in Fig. 3. We also compared the Binospec velocities with the SITELLE velocities for 12 overlapping regions, all close to the galaxy. Velocities are always consistent within the combined uncertainties of both measurements.
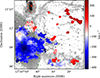 |
Fig. 3. SITELLE velocity map in the region shown in Fig. 1, overlaid on the net Hα image in the grey scale. The big green ellipse in the dashed line shows the D25 aperture of NGC 4569, while the small green ellipse in the dotted line is 1/3 of the size of the big green ellipse. NGC 4569’s nucleus is marked by a green cross. One can observe the disk rotation close to the nucleus and the truncated Hα disk (e.g., Boselli et al. 2016). The red ellipse in the dashed line shows the D25 aperture of IC 3583 with a velocity of 1121 km s−1. Its interaction with NGC 4569 was excluded by Boselli et al. (2016). |
6. Results
6.1. The velocity field
NGC 4569’s western side is the near side and its southern side has lower radial velocity than the northern side (e.g., Vollmer et al. 2004; Chemin et al. 2006), as expected since its spiral arms are trailing arms. This galactic rotation pattern, as shown in Fig. 3, is also observed in stripped clumps (Fig. 1), at least within ∼50 kpc from the galaxy. Along the tail, there is a clear radial velocity gradient, starting from the system velocity of the galaxy to roughly the system velocity of the Virgo cluster. This shows clear evidence of stripped clouds being decelerated by the local RPS, eventually becoming kinematically mixed with the surrounding ICM and losing the memory of infall. The average radial velocity gradient over the projected length of the tail is ∼5.6 km s−1 kpc−1, which is about half of that observed for the orphan cloud in A1367 but at smaller scales (Ge et al. 2021).
Stripped clouds are subject to both local drag force and the gravity from NGC 4569, so it is difficult to solve its deceleration history analytically. If we ignore NGC 4569’s gravity, the deceleration of the cloud can be written as dυ/dt = −bυ2, where υ is the velocity of the cloud relative to the surrounding medium and b is the deceleration parameter. Here, b can be written as ρICM/(ρcloudh), where h is the length of the cloud along the ram pressure direction and ρcloud and ρICM are the density of the cloud and the ICM, respectively. Here, ρcloudh is also the column density of the cloud. Such an equation can be solved to obtain the relation between the traveled distance and velocity, l = ln(υ0/υ)/b, where υ0 is the initial velocity. The distance of the cloud to the galaxy is then the distance traveled by the galaxy after time t minus the above distance traveled by the stripped cloud.
The above solution is a 1D solution. We need to connect the radial velocity and projected distance on the plane of sky, which can be done by assuming a constant angle with the line of sight for NGC 4569’s motion (θ = 0 corresponds to motion fully along the line of sight). Thus, the projected distance and the radial velocity of stripped clouds can be written as: lsky = (ξ − 1 − lnξ) sin θ/b, where ξ = υ0, rad/υrad and the subscripts sky and rad mean the sky and radial component respectively. Such a simple model can well describe the observed cloud velocities in the latter half of the tail (e.g., beyond 120 kpc), with sin θ/b= 100–140 kpc and assuming υ0, rad = 1300 km s−1. However the cloud deceleration is too fast close to the galaxy, which is not surprising for the lack of gravity to slow down deceleration in the simple model.
We can also estimate the timescale when the velocity is reduced to ∼200 km s−1 from the cluster velocity when the typical ICM bulk motion and turbulence begin to take over (e.g., Xrism Collaboration 2025). The timescale is τ = 5.5 sin θ/(bυ0, rad), where 5.5 = 1300/200–1. For sin θ/b = 120 kpc, the timescale is 0.50 Gyr. This timescale is 2.9 times larger than the time required for a clump to travel 230 kpc with a 1300 km/s velocity (if NGC 4569’s projected velocity is similar to its radial velocity), as stripped clouds would follow NGC 4569 and take time to slow down. We note that this timescale is longer than the derived timescales of 100–300 Myr for the peak of ram pressure stripping from Vollmer et al. (2004) and Boselli et al. (2006). However, the Hα clumps that are far away from NGC 4569 might actually be tracing the ISM or circumgalactic medium (CGM) stripped long before the peak of ram pressure stripping. In another VESTIGE paper, Sarpa et al. (2025) will present a detailed kinematic code to study the infall of cluster galaxies such as NGC 4569 more accurately.
We emphasize that the current slit sampling is not unbiased, limited by the slit positioning and the available Hα imaging data. Some regions beyond 80 kpc are poorly covered. The true extent of Hα clumps may also be longer than what is known now, which requires more observations near the end of the Hα tail. There is spread or scatter of velocities at fixed distance from the galaxy, which should come from the combination of remaining galactic rotation and developing of turbulence in the tail.
Because of the incomplete coverage and intrinsic scatter of velocities from galactic rotation and the ICM turbulence, a rigorous modeling is difficult. There is also another likely source of contamination coming from Galactic clouds, which could explain some of the low-velocity clouds (e.g., those six discussed earlier). The simple model also ignores the gravity between the stripped clouds and the parent galaxy, which slows down deceleration to make the actual age longer. The stripped clouds may also get ablated with time, which effectively reduces the cloud column density and decreases sin θ/b with distance. The stripped ISM and CGM can also be mixed with the surrounding ICM (e.g., Tonnesen & Bryan 2021).
6.2. The typical properties of the Hα clumps/filaments
The Hα tail is delineated by many clumps and filaments, while a diffuse component with a high covering fraction is absent, at least from the current data. The clumps and filaments are often in structure complexes, such as the three examples highlighted in Fig. 1. The complex in zoom-in a consists of clumps with typical size of ∼0.5 kpc, with fainter emission connecting clumps. Its full extent, pointing back to NGC 4569, is ∼31 kpc. The typical Hα + [N II] surface brightness is ∼5.5 × 10⁻¹⁸ erg s−1 cm−2 arcsec−2 at ∼0.6 kpc linear scales. The complex in zoom-in b has some long filaments with length up to 8 kpc. While NGC 4531 is projected nearby, their velocities are very different. The complex in the right side of zoom-in c has a linear extent of ∼22 kpc, with a similar surface brightness to other complexes. We note that the VESTIGE Hα data are not sensitive to faint, diffuse emission because of the scattered light and flat field. On the other hand, this component is absent even close to NGC 4569, where Hα emission mainly comes from bright filaments, in contrast to many other RPS galaxies, such as ESO 137-001 (Luo et al. 2023), along with many in Coma and A1367 (e.g., Yagi et al. 2010; Pedrini et al. 2022), as well as some GASP galaxies (e.g., Tomičić et al. 2021). No matter whether a very faint, diffuse Hα component exists in NGC 4569’s tail, the warm, ionized gas is unlikely to be the dominant contributor to the mass budget given its small filling factor (e.g., Sun et al. 2010; Jáchym et al. 2017; Sun et al. 2021). Thus, we did not estimate its total mass, which would also depend on the assumed geometry.
Similarly to the ionized gas within 80 kpc from NGC 4569, discussed in Boselli et al. (2016), there are no compact young star clusters detected from the Next Generation Virgo Cluster Survey (NGVS) optical data and the deep Galex data, as discussed in Boselli et al. (2016). We also attempted such a search with the VESTIGE Hα imaging data. We used SEXTRACTOR with the same criteria to select compact emission-line regions as in Waldron et al. (2023). An Hα luminosity lower limit of 5 × 1036 erg s−1 within a circular aperture with a radius of 1.5″ was also set, as existing VESTIGE studies of H II regions have the Hα luminosity completeness cut-off set at 1037 erg s−1 (e.g., Boselli et al. 2025). Furthermore, [N II] λ6584/Hα = 0.5 was also assumed. No such emission-line regions were detected beyond 50 kpc from NGC 4569’s nucleus in the tail, with the highest Hα luminosity at ∼3 × 1036 erg s−1 in several long filaments. Thus, SF is unlikely to be the main ionization mechanism for the tail Hα clouds. We examined the [N II]/Hα and [S II]/Hα ratios when possible, as shown in Fig. 4. While the Galactic extinction has been corrected, the intrinsic extinction is not corrected, as the ionization mechanism is unclear. The effect on these diffuse regions should be very small for these two ratios. The [N II]/Hα ratios of these clouds are 0.25–3.0 with a median of 0.75. The [S II]/Hα ratios are 0.2–3.0 with a median of 0.64. These elevated ratios suggested ionization mechanisms other than young stars, such as shocks or mixing with the hot ICM (e.g., Pedrini et al. 2022). Low [N II]/Hα and [S II]/Hα ratios also do not necessarily correspond to star-forming regions (e.g., Ge et al. 2021; Pedrini et al. 2022). Detailed studies of line diagnostics will be included in a future paper.
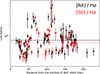 |
Fig. 4. [N II]λ6584 Å/Hα ratios for 88 clumps and the [S II]λλ6716, 6731 / Hα ratios for 49 clumps trailing NGC 4569 versus the distance from the nucleus of NGC 4569. Dashed lines show the median ratios. The uncertainty is 1σ. |
7. Discussion and conclusions
The dominant role of RPS on the evolution of NGC 4569 is previously known (e.g., Vollmer et al. 2004; Boselli et al. 2006, 2016). This work extends the 80 kpc Hα tail discovered by Boselli et al. (2016) to at least 230 kpc projected distance from the galaxy, while also establishing a coherent radial velocity gradient along the Hα clumps/filaments. While NGC 4531 is projected near the end of the long Hα tail, it is clearly separated from the nearby Hα clumps in velocity space. We also examined the VESTIGE and NGVS deep optical continuum imaging data. No tidal features are detected close to NGC 4531. Thus, there is no evidence for any impact from NGC 4531 on NGC 4569’s long Hα tail. We also examined other nearby Virgo cluster galaxies. The Hα clump at the end of the tail is 0.79 deg from NGC 4569 and 0.88 deg from M87. Within 1 deg of that clump, there are no other Virgo late-type or irregular galaxies that are at least brighter than NGC 4531’s magnitude + 1 mag at the r band. There is also no evidence of Hα connection to any galaxies other than NGC 4569.
With this discovery, we can confirm that NGC 4569 is characterized by the longest Hα RPS tail known. Before this discovery, the longest RPS tail is UGC 6697 in A1367, with its mostly straight Hα tail, traced nearly 150 kpc from the nucleus (Yagi et al. 2017). CGCG 97-079 in A1367 has a Hα tail that has been detected out to nearly 140 kpc from its nucleus (Yagi et al. 2017). A few RPS tails have been traced up to ∼90–100 kpc from the nucleus, including ESO 137-001 in Hα and X-rays (Sun et al. 2021; Luo et al. 2023), NGC 4848 and IC 4040 in Hα (Yagi et al. 2010), JO 206 in Hα (Ramatsoku et al. 2019), and IC 2276 in radio (Roberts et al. 2024). Two very long and mostly linear stellar tails have also been revealed, Kite (∼380 kpc, Zaritsky et al. 2023) and GMP 2640 (∼250 kpc, Grishin et al. 2021), but there is little diffuse gas known and it is unclear whether RPS is the only mechanism there. The 250 kpc H I tail at the back of FGC 1287 in A1367 might have a more complicated origin, as the available RP does not seem to be not strong enough to remove the observed amount of H I gas from the galaxy at its current location (Scott et al. 2022).
Our model (Section 6.1) gives the deceleration timescale of a stripped cloud, which is essentially the same as the drag time for a cold cloud accelerating by a wind, typically found in studies of ISM and CGM (e.g., Klein et al. 1994; Gronke & Oh 2018). On the other hand, the destruction timescale of the cloud would be ∼(ρcloud/ρICM)1/2 smaller than the drag time or the deceleration timescale (e.g., Klein et al. 1994). While (ρcloud/ρICM)1/2 is uncertain, it should be larger than 10, based on, for instance, the thermal pressure equilibrium argument. Thus, the stripped clouds are not expected to survive for such a long time or to be found so far away from the galaxy. This is the classical cloud crushing problem. The typical solution involves mixing with the ICM and the enhanced cooling in the mixing layer (e.g., Gronke & Oh 2018; Ji et al. 2019; Tonnesen & Bryan 2021). Thermal conduction may also help to extend the cloud’s lifetime (e.g., Sander & Hensler 2021). Alternatively, the ISM could be stripped as a whole entity, with only a small fraction of dense clouds left behind, as suggested by Vollmer et al. (2012).
While wide-field broad-band optical imaging surveys have become routine, the discovery space for sensitive narrow-band imaging surveys remains vast (e.g., Lokhorst et al. 2022; Drechsler et al. 2023). The ISM removed from cluster galaxies pollute the hot ICM and the growing number of examples (see the discussion in Boselli et al. 2022 and their example) suggest that those cold and warm ISM can survive for at least Gyr. NGC 4569 showcases the potential to use wide-field Hα surveys + follow-up optical spectroscopy to study the ICM kinematics and the stripping history of cluster galaxies. Stripped clouds can survive for at least ∼0.5 Gyr and continue to shine in Hα. If detected individually far from the parent galaxy (e.g., clouds near the end of NGC 4569’s tail), they could resemble the orphan cloud in A1367 (Yagi et al. 2017; Ge et al. 2021). More examples will hopefully be revealed in the future. Evolution of the stripped clouds in galaxy clusters also allows detailed studies of the related micro transport processes in mixing between the cold, stripped gas and the hot ICM. Intracluster space might light up in Hα once we reach below 10−19 erg s−1 cm−2 arcsec−2 at kpc2 scales with data from, for instance, MOTHRA (Lokhorst et al. 2022), while the data presented in this work only give a glimpse of what is to come in the future.
Data availability
The data shown in Fig. 1 and the SITELLE data products used for the analysis are available at the CDS via https://cdsarc.cds.unistra.fr/viz-bin/cat/J/A+A/705/A139
Acknowledgments
MS thanks Ben Weiner for help on the MMT observations and data analysis. MS thanks Greg Bryan for helpful discussion. Support for this work was provided by the NSF grant 2407821. WF acknowledges support from the Smithsonian Institution. This research is also based on observations obtained with the APO 3.5-meter telescope, which is owned and operated by the Astrophysical Research Consortium. We are grateful to the whole CFHT team who assisted us in the preparation and in the execution of the observations and in the calibration and data reduction: Todd Burdullis, Daniel Devost, Bill Mahoney, Nadine Manset, Andreea Petric, Simon Prunet, Kanoa Withington. Based on observations obtained with SITELLE, a joint project between Universite Laval, ABB-Bomem, Universite de Montreal, and the Canada-France-Hawaii Telescope (CFHT) with funding support from the Canada Foundation for Innovation (CFI), the National Sciences and Engineering Research Council of Canada (NSERC), Fond de Recheche du Quebec – Nature et Technologies (FRQNT) and CFHT. The Canada-France-Hawaii Telescope is operated from the summit of Maunakea by the National Research Council of Canada, the Institut National des Sciences de l’Univers of the Centre National de la Recherche Scientifique of France, and the University of Hawaii. The observations at the Canada-France-Hawaii Telescope were performed with care and respect from the summit of Maunakea which is a significant cultural and historic site. This research has made use of the NASA/IPAC Extragalactic Database (NED) which is operated by the Jet Propulsion Laboratory, California Institute of Technology, under contract with the National Aeronautics and Space Administration.
References
- Boselli, A., Boissier, S., Cortese, L., et al. 2006, ApJ, 651, 811 [Google Scholar]
- Boselli, A., Voyer, E., Boissier, S., et al. 2014, A&A, 570, A69 [NASA ADS] [CrossRef] [EDP Sciences] [Google Scholar]
- Boselli, A., Cuillandre, J. C., Fossati, M., et al. 2016, A&A, 587, A68 [NASA ADS] [CrossRef] [EDP Sciences] [Google Scholar]
- Boselli, A., Fossati, M., Ferrarese, L., et al. 2018, A&A, 614, A56 [NASA ADS] [CrossRef] [EDP Sciences] [Google Scholar]
- Boselli, A., Fossati, M., & Sun, M. 2022, A&ARv, 30, 3 [NASA ADS] [CrossRef] [Google Scholar]
- Boselli, A., Fossati, M., Roehlly, Y., et al. 2025, A&A, 696, A78 [NASA ADS] [CrossRef] [EDP Sciences] [Google Scholar]
- Cappellari, M., Emsellem, E., Krajnović, D., et al. 2011, MNRAS, 413, 813 [Google Scholar]
- Cayatte, V., van Gorkom, J. H., Balkowski, C., & Kotanyi, C. 1990, AJ, 100, 604 [NASA ADS] [CrossRef] [Google Scholar]
- Chemin, L., Balkowski, C., Cayatte, V., et al. 2006, MNRAS, 366, 812 [NASA ADS] [CrossRef] [Google Scholar]
- de Vaucouleurs, G., de Vaucouleurs, A., Corwin, H. G., Jr., et al. 1991, Third Reference Catalogue of Bright Galaxies [Google Scholar]
- Drechsler, M., Strottner, X., Sainty, Y., et al. 2023, Res. Notes AAS, 7, 1 [Google Scholar]
- Drissen, L., Martin, T., Rousseau-Nepton, L., et al. 2019, MNRAS, 485, 3930 [NASA ADS] [CrossRef] [Google Scholar]
- Epinat, B., Tasca, L., Amram, P., et al. 2012, A&A, 539, A92 [NASA ADS] [CrossRef] [EDP Sciences] [Google Scholar]
- Fabricant, D., Fata, R., Epps, H., et al. 2019, PASP, 131, 075004 [NASA ADS] [CrossRef] [Google Scholar]
- Fitzpatrick, E. L. 1999, PASP, 111, 63 [Google Scholar]
- Gavazzi, G., Boselli, A., Mayer, L., et al. 2001, ApJ, 563, L23 [Google Scholar]
- Ge, C., Luo, R., Sun, M., et al. 2021, MNRAS, 505, 4702 [NASA ADS] [CrossRef] [Google Scholar]
- Grishin, K. A., Chilingarian, I. V., Afanasiev, A. V., et al. 2021, Nat. Astron., 5, 1308 [NASA ADS] [CrossRef] [Google Scholar]
- Gronke, M., & Oh, S. P. 2018, MNRAS, 480, L111 [Google Scholar]
- Jáchym, P., Sun, M., Kenney, J. D. P., et al. 2017, ApJ, 839, 114 [Google Scholar]
- Ji, S., Oh, S. P., & Masterson, P. 2019, MNRAS, 487, 737 [Google Scholar]
- Kashibadze, O. G., Karachentsev, I. D., & Karachentseva, V. E. 2020, A&A, 635, A135 [NASA ADS] [CrossRef] [EDP Sciences] [Google Scholar]
- Klein, R. I., McKee, C. F., & Colella, P. 1994, ApJ, 420, 213 [Google Scholar]
- Lokhorst, D. M., Chen, S., Pasha, I., et al. 2022, SPIE Conf. Ser., 12182, 121821T [Google Scholar]
- Luo, R., Sun, M., Jáchym, P., et al. 2023, MNRAS, 521, 6266 [NASA ADS] [CrossRef] [Google Scholar]
- Martin, T., Drissen, L., & Joncas, G. 2015, ASP Conf. Ser., 495, 327 [Google Scholar]
- Mei, S., Blakeslee, J. P., Côté, P., et al. 2007, ApJ, 655, 144 [Google Scholar]
- Pedrini, A., Fossati, M., Gavazzi, G., et al. 2022, MNRAS, 511, 5180 [NASA ADS] [CrossRef] [Google Scholar]
- Poggianti, B. M., Moretti, A., Gullieuszik, M., et al. 2017, ApJ, 844, 48 [Google Scholar]
- Ramatsoku, M., Serra, P., Poggianti, B. M., et al. 2019, MNRAS, 487, 4580 [Google Scholar]
- Roberts, I. D., van Weeren, R. J., Lal, D. V., et al. 2024, A&A, 683, A11 [NASA ADS] [CrossRef] [EDP Sciences] [Google Scholar]
- Sander, B., & Hensler, G. 2021, MNRAS, 501, 5330 [NASA ADS] [CrossRef] [Google Scholar]
- Scott, T. C., Cortese, L., Lagos, P., et al. 2022, MNRAS, 511, 980 [NASA ADS] [CrossRef] [Google Scholar]
- Sun, M., Donahue, M., Roediger, E., et al. 2010, ApJ, 708, 946 [Google Scholar]
- Sun, M., Ge, C., Luo, R., et al. 2021, Nat. Astron., 6, 270 [NASA ADS] [CrossRef] [Google Scholar]
- Tomičić, N., Vulcani, B., Poggianti, B. M., et al. 2021, ApJ, 922, 131 [CrossRef] [Google Scholar]
- Tonnesen, S., & Bryan, G. L. 2021, ApJ, 911, 68 [NASA ADS] [CrossRef] [Google Scholar]
- Vollmer, B., Balkowski, C., Cayatte, V., van Driel, W., & Huchtmeier, W. 2004, A&A, 419, 35 [CrossRef] [EDP Sciences] [Google Scholar]
- Vollmer, B., Soida, M., Braine, J., et al. 2012, A&A, 537, A143 [NASA ADS] [CrossRef] [EDP Sciences] [Google Scholar]
- Waldron, W., Sun, M., Luo, R., et al. 2023, MNRAS, 522, 173 [NASA ADS] [CrossRef] [Google Scholar]
- Xrism Collaboration (Audard, M., et al.) 2025, ApJ, 993, L11 [Google Scholar]
- Yagi, M., Yoshida, M., Komiyama, Y., et al. 2010, AJ, 140, 1814 [Google Scholar]
- Yagi, M., Yoshida, M., Gavazzi, G., et al. 2017, ApJ, 839, 65 [NASA ADS] [CrossRef] [Google Scholar]
- Zaritsky, D., Crossett, J. P., Jaffé, Y. L., et al. 2023, MNRAS, 524, 1431 [Google Scholar]
All Tables
All Figures
|
Fig. 1. Top: Net Hα image showing the extended optical emission-line clumps/filaments trailing NGC 4569. Bright stars and their scattered halos are masked. The black box in the dashed line is the SITELLE field shown in Fig. 3. Three zoom-ins are also shown. The direction toward M87 is also shown at the lower right corner. Note: the clumps and filaments around NGC 4531 have very different velocities from NGC 4531. Because of the various instrumental artifacts, spectroscopic follow-ups are required. Bottom-left: Same net Hα image as the one shown in the upper panel, with velocities of 94 clumps from Binospec overlaid. See Fig. 3 for velocities at the front part of the tail from SITELLE. Bottom-right: Velocities (with a 1σ uncertainty) of 94 clumps from Binospec in black, along with the kernel density estimation (KDE) of the SITELLE velocities (as shown in Fig. 3) versus distance from the nucleus of NGC 4569. The KDE shows the probability density function of the SITELLE velocities, with yellow as the highest density. For reference, NGC 4569 is at –235 km s−1 and NGC 4531 is at 90 km s−1. The velocity of the Virgo cluster A is 955 km s−1 from Boselli et al. (2014), while Kashibadze et al. (2020) gave a velocity of 1070 km s−1 for the Virgo cluster. The observed clumps show a smooth velocity gradient from NGC 4569 and there is no evidence for their connection with NGC 4531. The end of the detected Hα tail is nearly at rest (along the line of sight) with respect to the Virgo cluster mean velocity. There are a few clumps at distance ∼100 kpc with velocities of 50–100 km s−1. They are in three groups and marked in small blue circles in the top panel. Despite their similar velocities to those seen for NGC 4531, there is no spatial evidence to suggest a connection. |
| In the text | |
|
Fig. 2. Binospec spectra on four slit positions, from one of the brightest regions in the top, a region with median brightness in the row 2, to two spectra with about the least significant detections in our sample. Our best-fit model is shown in the red line. Only the portion around [N II], Hα, and [S II] is shown. The shown spectra are unbinned on the spectral axis with a 0.62 Å sampling. The central coordinate of each position (in brackets) and the best-fit velocity are shown in the top-right corner. |
| In the text | |
|
Fig. 3. SITELLE velocity map in the region shown in Fig. 1, overlaid on the net Hα image in the grey scale. The big green ellipse in the dashed line shows the D25 aperture of NGC 4569, while the small green ellipse in the dotted line is 1/3 of the size of the big green ellipse. NGC 4569’s nucleus is marked by a green cross. One can observe the disk rotation close to the nucleus and the truncated Hα disk (e.g., Boselli et al. 2016). The red ellipse in the dashed line shows the D25 aperture of IC 3583 with a velocity of 1121 km s−1. Its interaction with NGC 4569 was excluded by Boselli et al. (2016). |
| In the text | |
|
Fig. 4. [N II]λ6584 Å/Hα ratios for 88 clumps and the [S II]λλ6716, 6731 / Hα ratios for 49 clumps trailing NGC 4569 versus the distance from the nucleus of NGC 4569. Dashed lines show the median ratios. The uncertainty is 1σ. |
| In the text | |
Current usage metrics show cumulative count of Article Views (full-text article views including HTML views, PDF and ePub downloads, according to the available data) and Abstracts Views on Vision4Press platform.
Data correspond to usage on the plateform after 2015. The current usage metrics is available 48-96 hours after online publication and is updated daily on week days.
Initial download of the metrics may take a while.