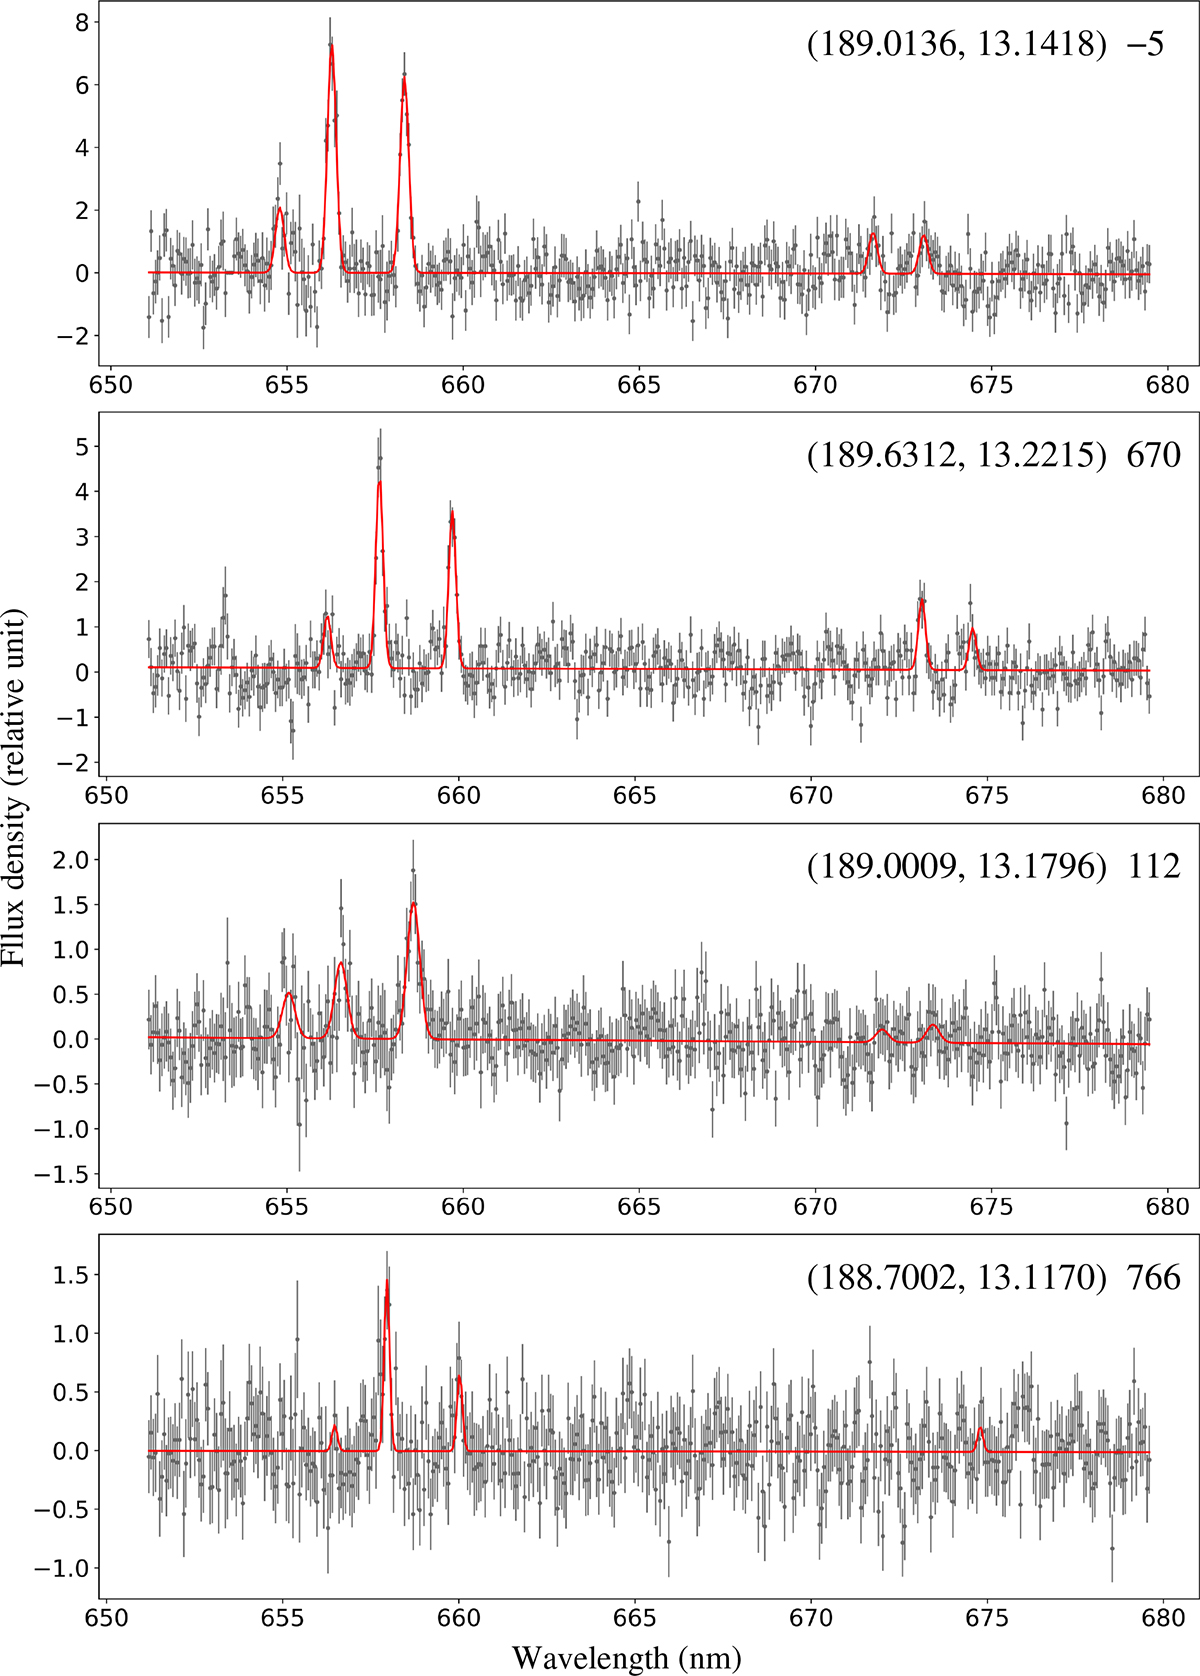
Fig. 2.
Download original image
Binospec spectra on four slit positions, from one of the brightest regions in the top, a region with median brightness in the row 2, to two spectra with about the least significant detections in our sample. Our best-fit model is shown in the red line. Only the portion around [N II], Hα, and [S II] is shown. The shown spectra are unbinned on the spectral axis with a 0.62 Å sampling. The central coordinate of each position (in brackets) and the best-fit velocity are shown in the top-right corner.
Current usage metrics show cumulative count of Article Views (full-text article views including HTML views, PDF and ePub downloads, according to the available data) and Abstracts Views on Vision4Press platform.
Data correspond to usage on the plateform after 2015. The current usage metrics is available 48-96 hours after online publication and is updated daily on week days.
Initial download of the metrics may take a while.