Open Access
Fig. 4.
Download original image
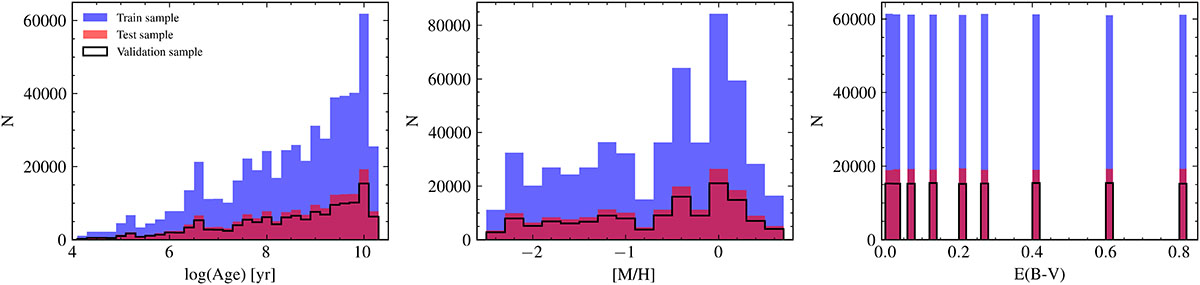
Age (left panel), metallicity (middle panel) and dust attenuation (right panel) distribution for the training (blue), test (red), and validation (empty black) sub-samples. The sub-samples are randomly selected, showing no differences in their distributions.
Current usage metrics show cumulative count of Article Views (full-text article views including HTML views, PDF and ePub downloads, according to the available data) and Abstracts Views on Vision4Press platform.
Data correspond to usage on the plateform after 2015. The current usage metrics is available 48-96 hours after online publication and is updated daily on week days.
Initial download of the metrics may take a while.