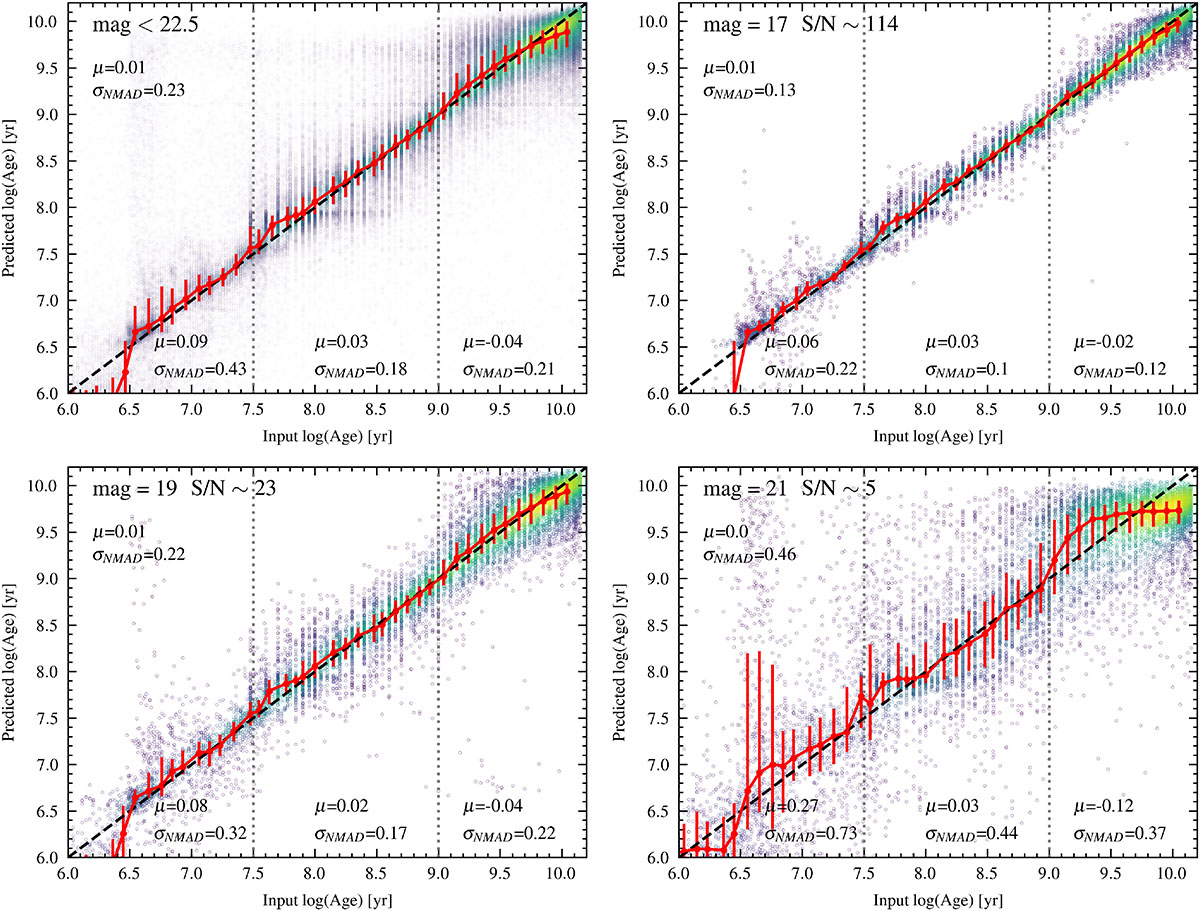
Fig. 5.
Download original image
Predicted age versus input age in different magnitude bins. The median μ and σNMAD of the residuals (Δ= output – input) are reported for the full sample and for the three age ranges delimited by the dashed vertical lines. Red points indicate the median values in age bins, with red error bars showing the interquartile range (25th to 75th percentiles) of the distribution. Symbols are colour-coded by number density (more populated regions are plotted in yellow). The upper-left panel shows the results for all the test sample, while the other three panels are limited to a given i magnitude bin, stated in the legend. The typical S/N in the narrow-band filters is also reported.
Current usage metrics show cumulative count of Article Views (full-text article views including HTML views, PDF and ePub downloads, according to the available data) and Abstracts Views on Vision4Press platform.
Data correspond to usage on the plateform after 2015. The current usage metrics is available 48-96 hours after online publication and is updated daily on week days.
Initial download of the metrics may take a while.