Fig. 7.
Download original image
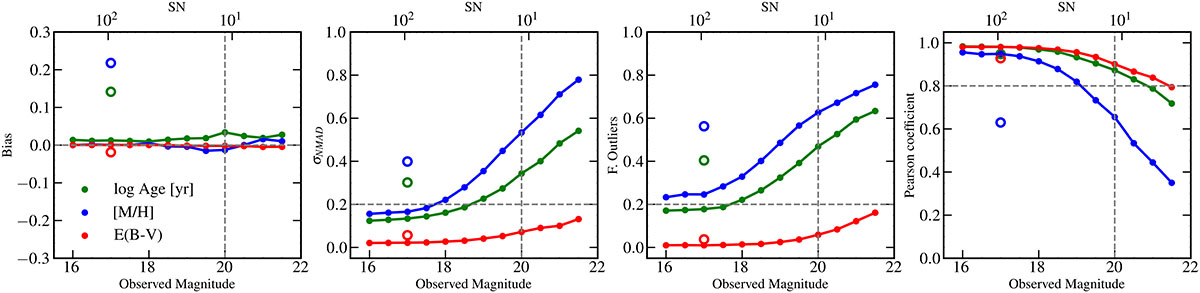
Summary of the metrics (from left to right, median bias, scatter, fraction of outliers, and Pearson coefficient) in bins of of ‘observed’ magnitude in the i-band (and average S/N in the narrow-band filters) for the age (green), metallicity (blue), and dust attenuation (red) predictions. The empty circles are the metrics obtained by means of SED-fitting (details in Sect. 5.1) on the i∼ 17 mag bin, highlighting the improved performance of the NN estimates.
Current usage metrics show cumulative count of Article Views (full-text article views including HTML views, PDF and ePub downloads, according to the available data) and Abstracts Views on Vision4Press platform.
Data correspond to usage on the plateform after 2015. The current usage metrics is available 48-96 hours after online publication and is updated daily on week days.
Initial download of the metrics may take a while.