Fig. 9.
Download original image
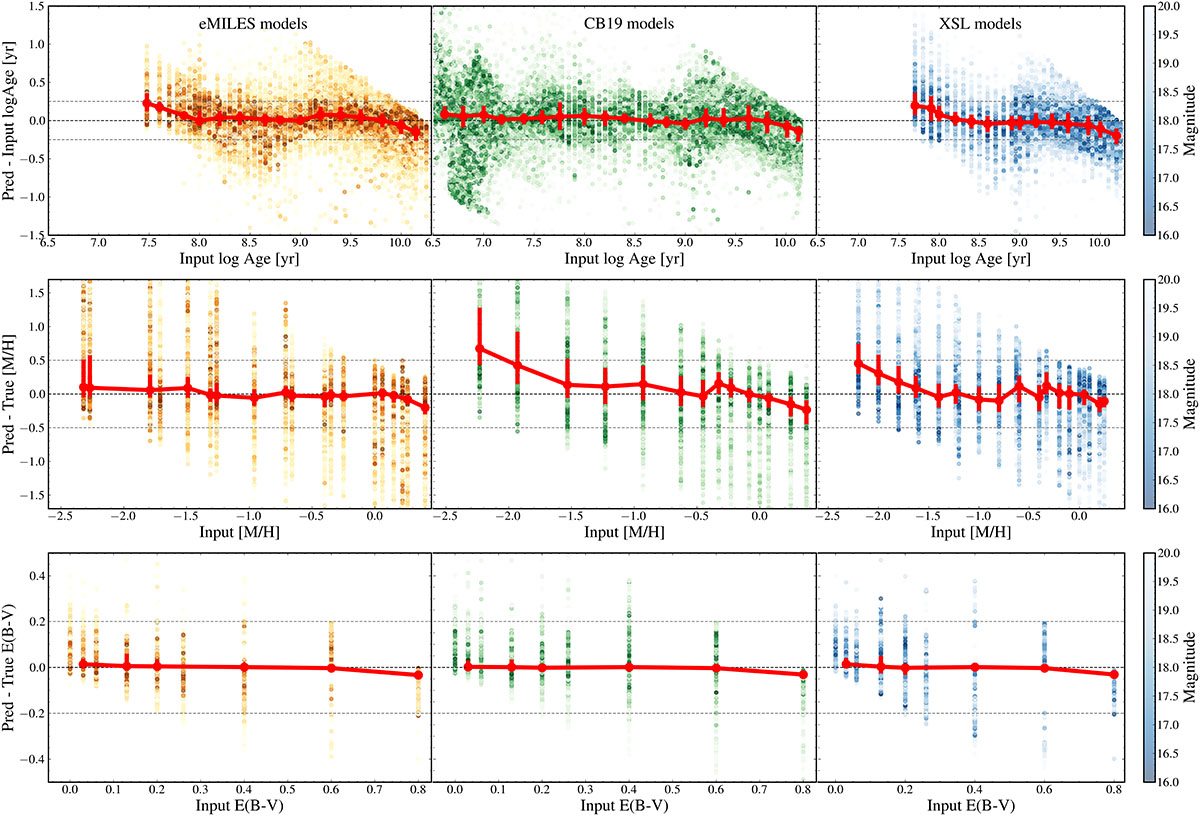
Difference between the predicted and the input parameters from top to bottom: log(Age), [M/H] and E(B-V) for the sample limited to i < 19.5, divided into different SSP synthetic photometry (from left to right: E-MILES, CB19, and XSL). The colour intensity corresponds to the ‘observed’ magnitude. Red points indicate the median values in bins, with red error bars showing the interquartile range (25th to 75th percentiles) of the distribution.
Current usage metrics show cumulative count of Article Views (full-text article views including HTML views, PDF and ePub downloads, according to the available data) and Abstracts Views on Vision4Press platform.
Data correspond to usage on the plateform after 2015. The current usage metrics is available 48-96 hours after online publication and is updated daily on week days.
Initial download of the metrics may take a while.