Fig. 1.
Download original image
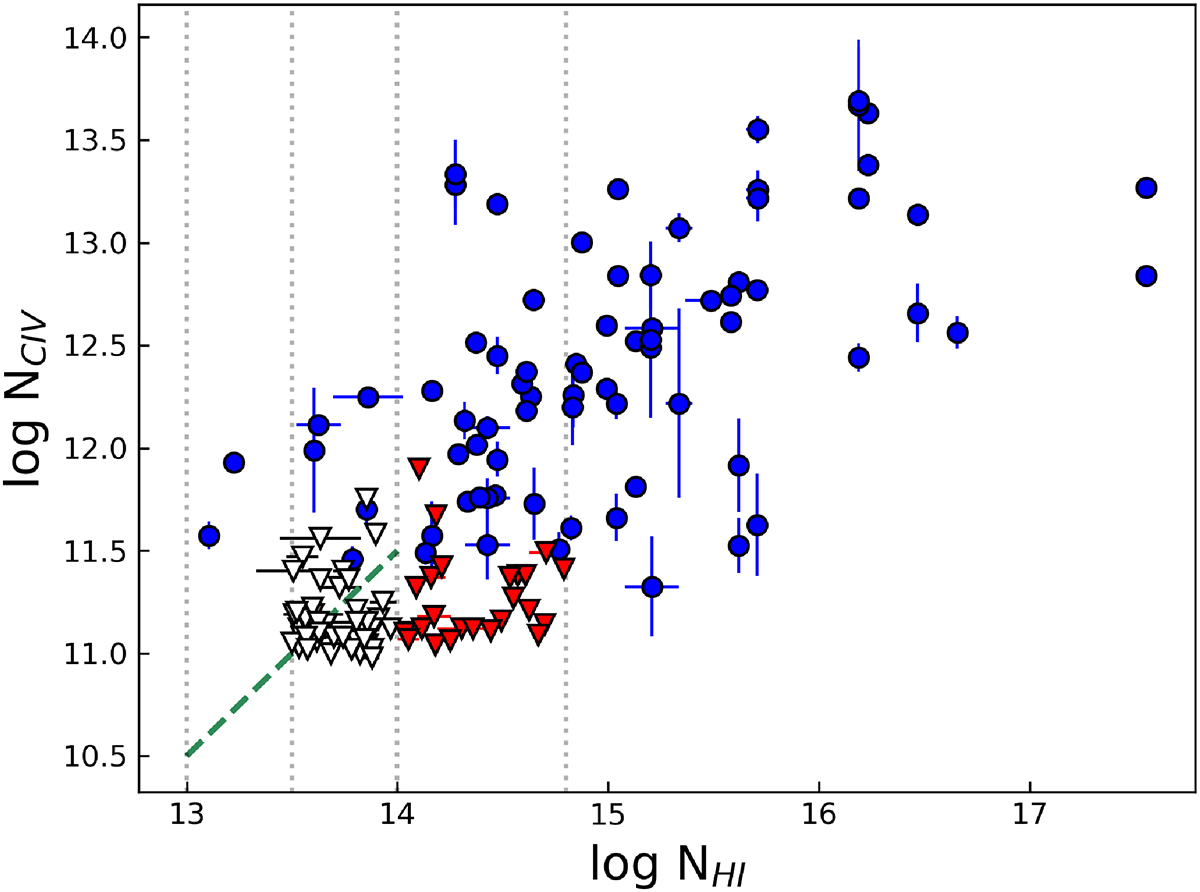
C IV column density, log NCIV, versus the associated column density of neutral hydrogen, log NHI. The vertical dotted lines mark the values of log NHI = 13.0, 13.5, 14.0, and 14.8. Blue data points represent the detected C IV systems identified by D16; white triangles indicate the upper limits on log NCIV, which we used to derive the mock measurements (see Sect. 4.3). The red triangles represent the upper limits in the range between log NHI = 14.0 and log NHI = 14.8, not included in our tests. The dashed green line indicates the relation log NCIV = log NHI − 2.5 which is used, in the range 13 < log NHI < 14, to create the mock systems for one of our tests, see Sect. 4.3.
Current usage metrics show cumulative count of Article Views (full-text article views including HTML views, PDF and ePub downloads, according to the available data) and Abstracts Views on Vision4Press platform.
Data correspond to usage on the plateform after 2015. The current usage metrics is available 48-96 hours after online publication and is updated daily on week days.
Initial download of the metrics may take a while.