Fig. 4.
Download original image
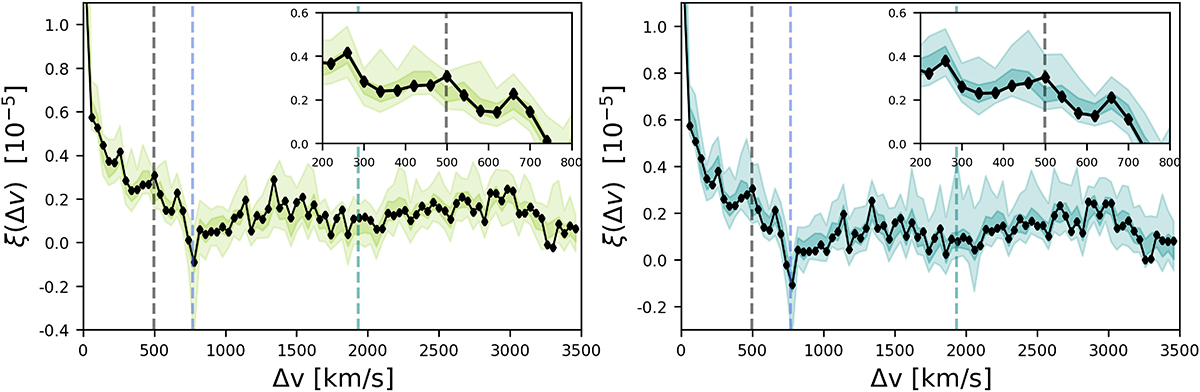
Left: TPCF computed on the spectrum in which we included the mock measurements derived from the upper limits in addition to the C IV systems associated with log NHI < 14.0. Right: TPCF for the case in which we set the column density value of the mock C IV measurements such that log NCIV = log NHI − 2.5 in the range 13 < log NHI < 14. The shaded coloured regions indicate the 1 σ and 3 σ regions obtained from the distributions of the TPCF values computed on the corresponding sets of mock spectra.
Current usage metrics show cumulative count of Article Views (full-text article views including HTML views, PDF and ePub downloads, according to the available data) and Abstracts Views on Vision4Press platform.
Data correspond to usage on the plateform after 2015. The current usage metrics is available 48-96 hours after online publication and is updated daily on week days.
Initial download of the metrics may take a while.