Fig. 11
Download original image
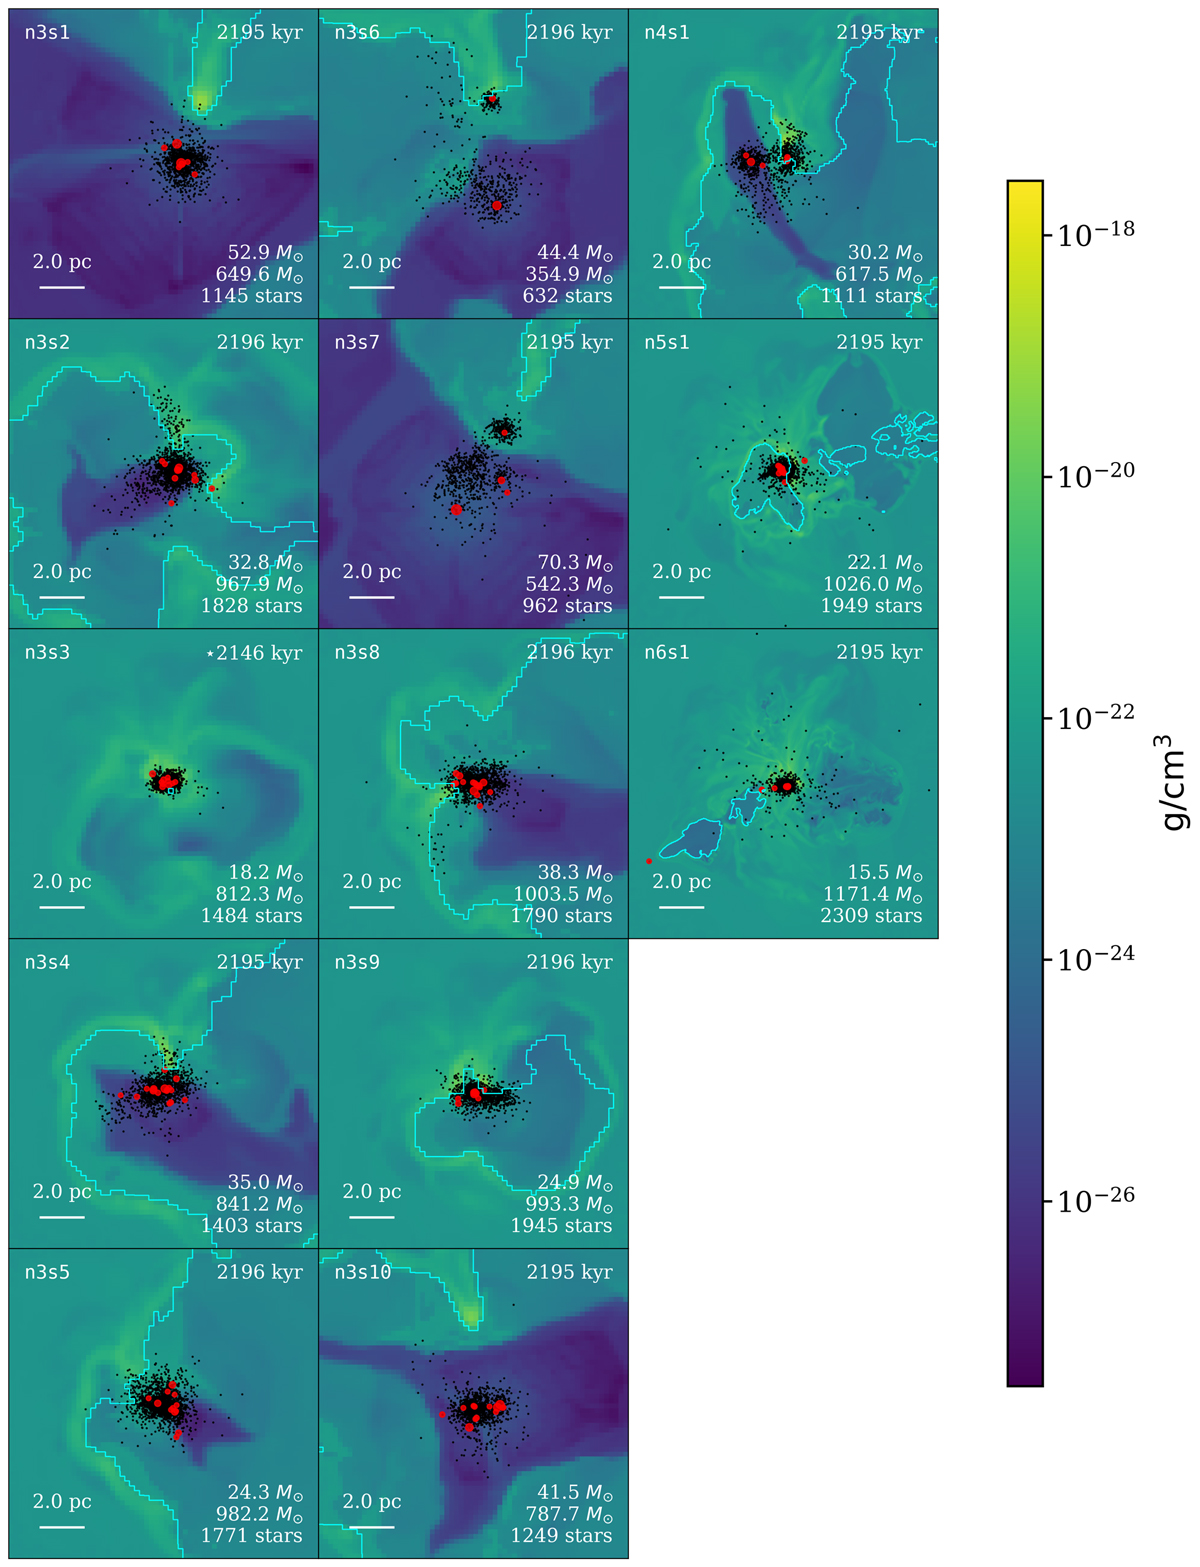
Snapshots of gas density and stellar distribution at 4tff for different maximum grid resolutions. The ionization fronts are marked with cyan lines. Stars are shown as black dots; massive stars are highlighted in red, with sizes proportional to their masses. In each panel, the following notations are used: (bottom left) physical scale; (bottom right) the mass of the most massive star, total stellar mass, and number of stars; (top left) model label; (top right) simulation time. The color scale indicates the gas density in grams per cubic centimetre. The panel for model n3s3, marked with a ★ (simulation time), is shown 40 kyr earlier than 4tff, because a 60 M⊙ star forms shortly afterward; at the displayed time, the feedback is dominated by an 18 M⊙ star.
Current usage metrics show cumulative count of Article Views (full-text article views including HTML views, PDF and ePub downloads, according to the available data) and Abstracts Views on Vision4Press platform.
Data correspond to usage on the plateform after 2015. The current usage metrics is available 48-96 hours after online publication and is updated daily on week days.
Initial download of the metrics may take a while.