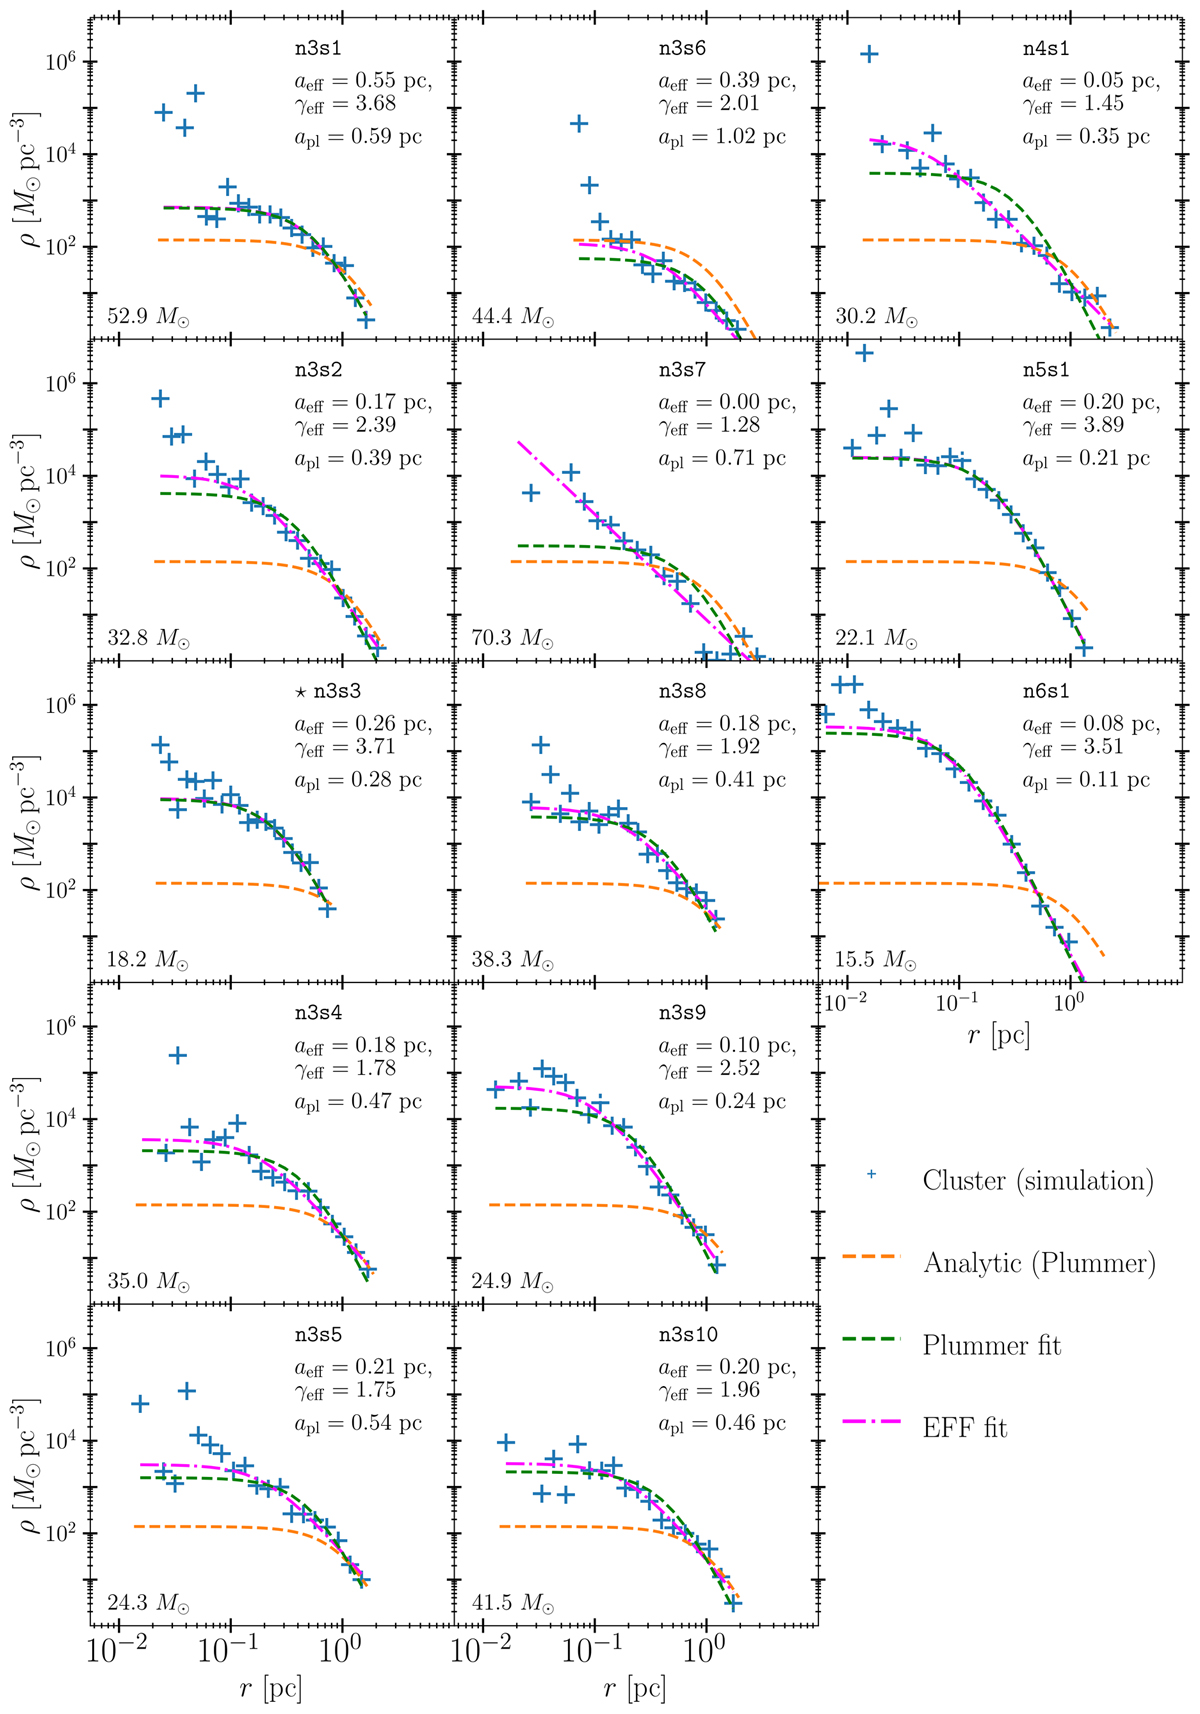
Fig. 2
Download original image
Stellar density profiles at 4tff (blue points) are compared with the analytically predicted Plummer profile for the stellar distribution (dashed orange line), as well as best-fit Plummer (dashed green) and EFF (dash-dotted magenta) models. The mass of the most massive star formed in each simulation is indicated in the lower left corner of each panel. The panel marked with a ★ (n3s3) is shown at a slightly earlier time; see also the text for details on subcluster cases.
Current usage metrics show cumulative count of Article Views (full-text article views including HTML views, PDF and ePub downloads, according to the available data) and Abstracts Views on Vision4Press platform.
Data correspond to usage on the plateform after 2015. The current usage metrics is available 48-96 hours after online publication and is updated daily on week days.
Initial download of the metrics may take a while.