Fig. 3
Download original image
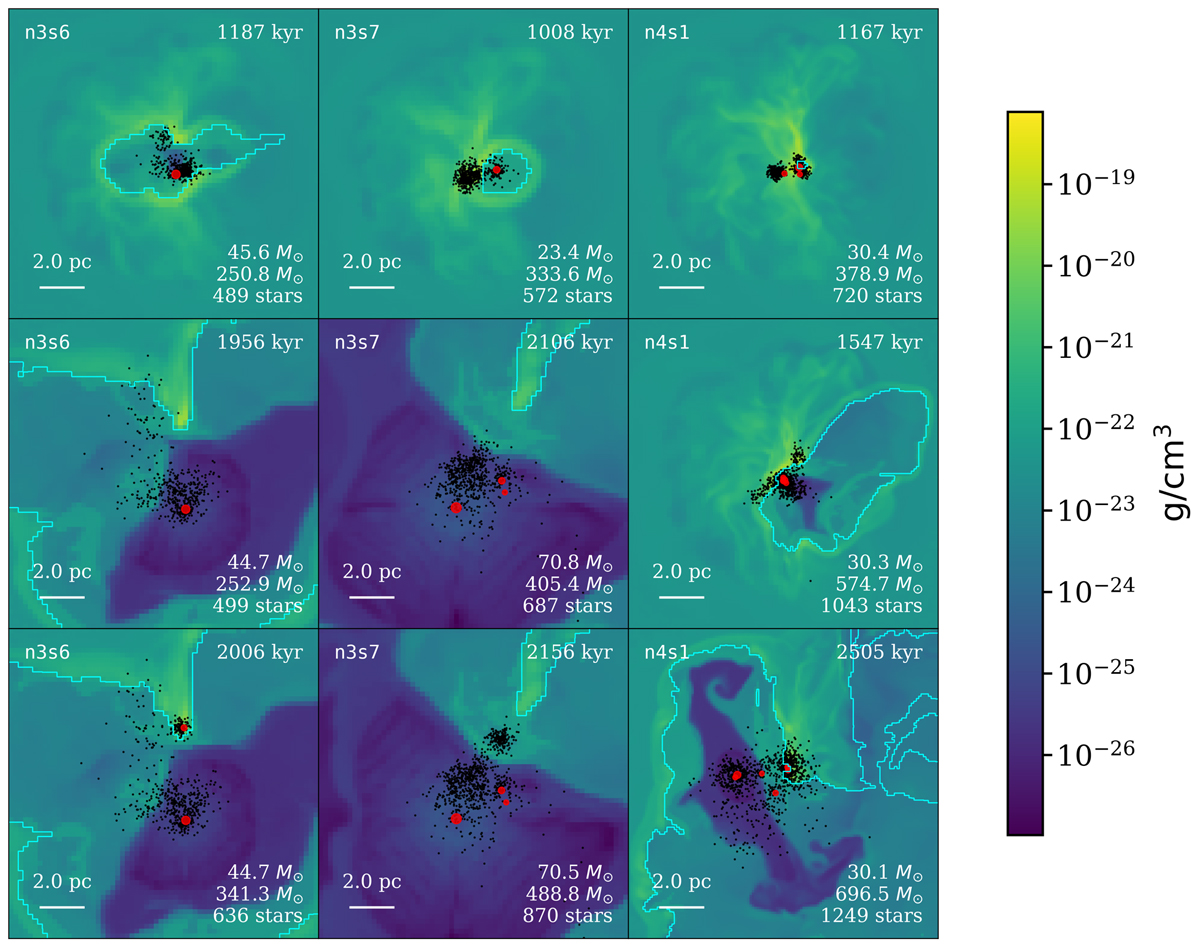
Gas density slices and stellar distribution projections from the n3s6, n3s7, and n4s1 models. In these models subcluster formation occurs. For n3s6 and n3s7: (top row) onset of stellar feedback; (middle row) prior to the formation of the second cluster; (bottom row) after the formation of the second cluster. For n4s1: (top row) two clusters are present; (middle row) clusters merge into a single structure; (bottom row) the system separates again into two clusters. Ionization fronts are indicated by the cyan line. Black dots indicate individual stars, with massive stars shown in red. The symbol size of massive stars is proportional to their mass. Annotations in each panel include: (bottom left) scale bar; (bottom right) mass of the most massive star, total stellar mass within 5.5 pc, and total number of stars; (top left) simulation label; (top right) simulation time. The color scale represents the gas density in grams per cubic centimetre.
Current usage metrics show cumulative count of Article Views (full-text article views including HTML views, PDF and ePub downloads, according to the available data) and Abstracts Views on Vision4Press platform.
Data correspond to usage on the plateform after 2015. The current usage metrics is available 48-96 hours after online publication and is updated daily on week days.
Initial download of the metrics may take a while.