Fig. 5
Download original image
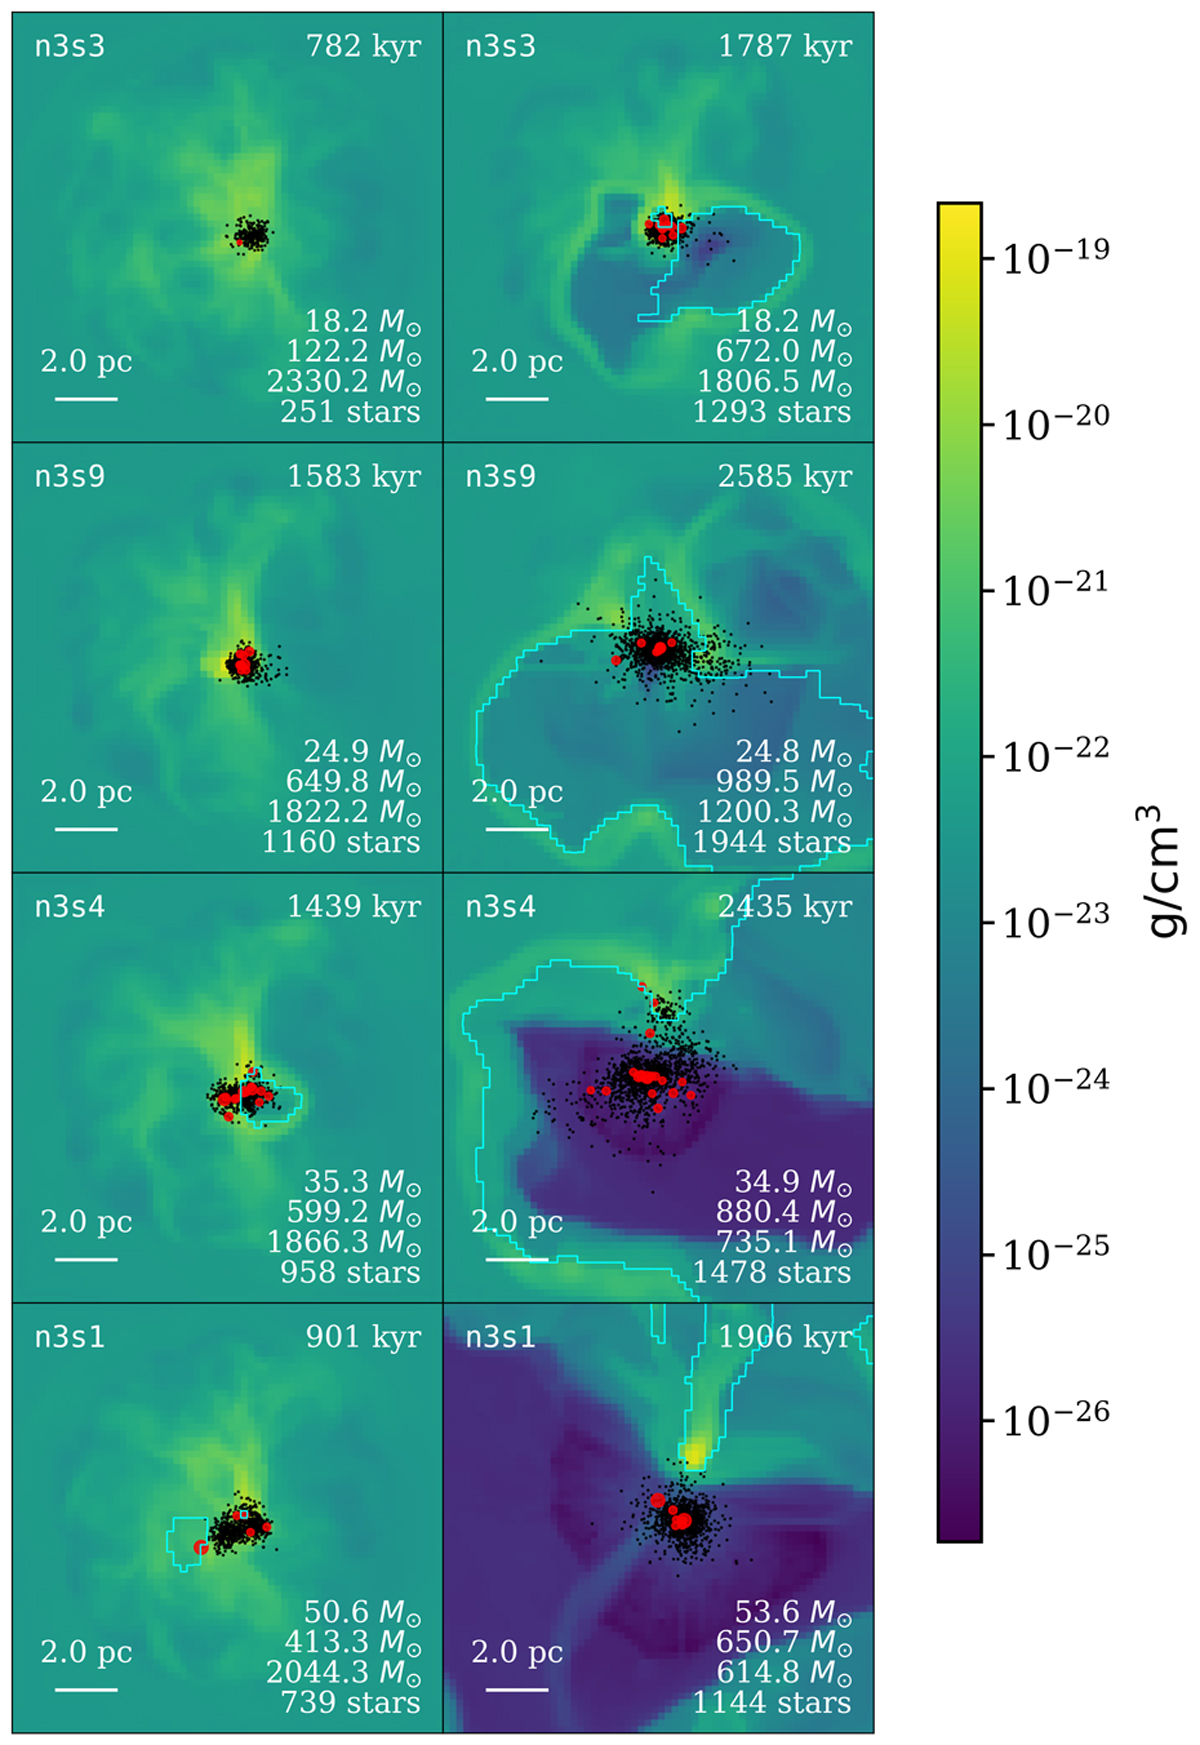
Slices of gas density and projected stellar distribution at the formation time in each model of the most massive star with M > 15 M⊙ (left column), and 1 Myr later (right column), for the n3s3, n3s9, n3s4, and n3s1 simulations. Ionization fronts are indicated by cyan lines. Black dots represent stars, while massive stars are shown in red; massive star symbol sizes are proportional to stellar mass. In n3s1, two most massive stars form: one with 50 M⊙ at 891 kyr (triggering feedback), and a second with 53 M⊙ at 1187 kyr. Annotations in each panel are (bottom left) physical scale; (bottom right) mass of the most massive star, total stellar mass within 5.5 pc, total gas mass within 5.5 pc, and number of stars; (top left) model; (top right) simulation time. The color scale represents the gas density.
Current usage metrics show cumulative count of Article Views (full-text article views including HTML views, PDF and ePub downloads, according to the available data) and Abstracts Views on Vision4Press platform.
Data correspond to usage on the plateform after 2015. The current usage metrics is available 48-96 hours after online publication and is updated daily on week days.
Initial download of the metrics may take a while.