Open Access
Fig. 6
Download original image
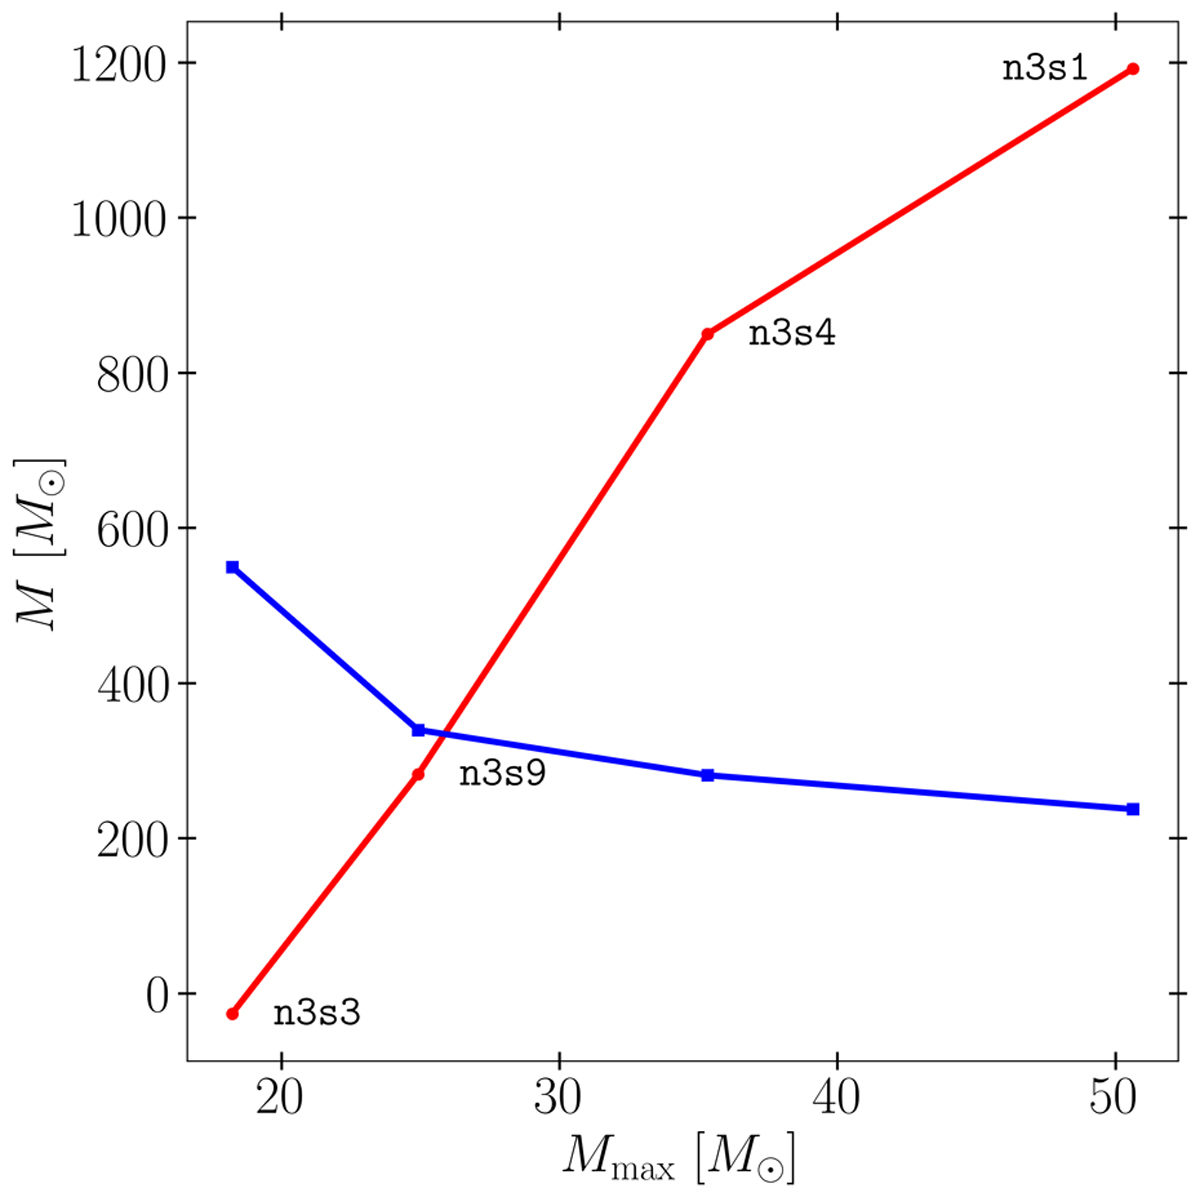
Stellar mass formed in first megayear after formation of most massive star (blue) and the gas mass lost due to feedback Mloss,fb (red) versus the mass of the most massive star for simulations n3s3, n3s9, n3s4, and n3s1. Simulation names are labeled next to each red dot. This is the same interval as in Figure 5.
Current usage metrics show cumulative count of Article Views (full-text article views including HTML views, PDF and ePub downloads, according to the available data) and Abstracts Views on Vision4Press platform.
Data correspond to usage on the plateform after 2015. The current usage metrics is available 48-96 hours after online publication and is updated daily on week days.
Initial download of the metrics may take a while.