Fig. 7
Download original image
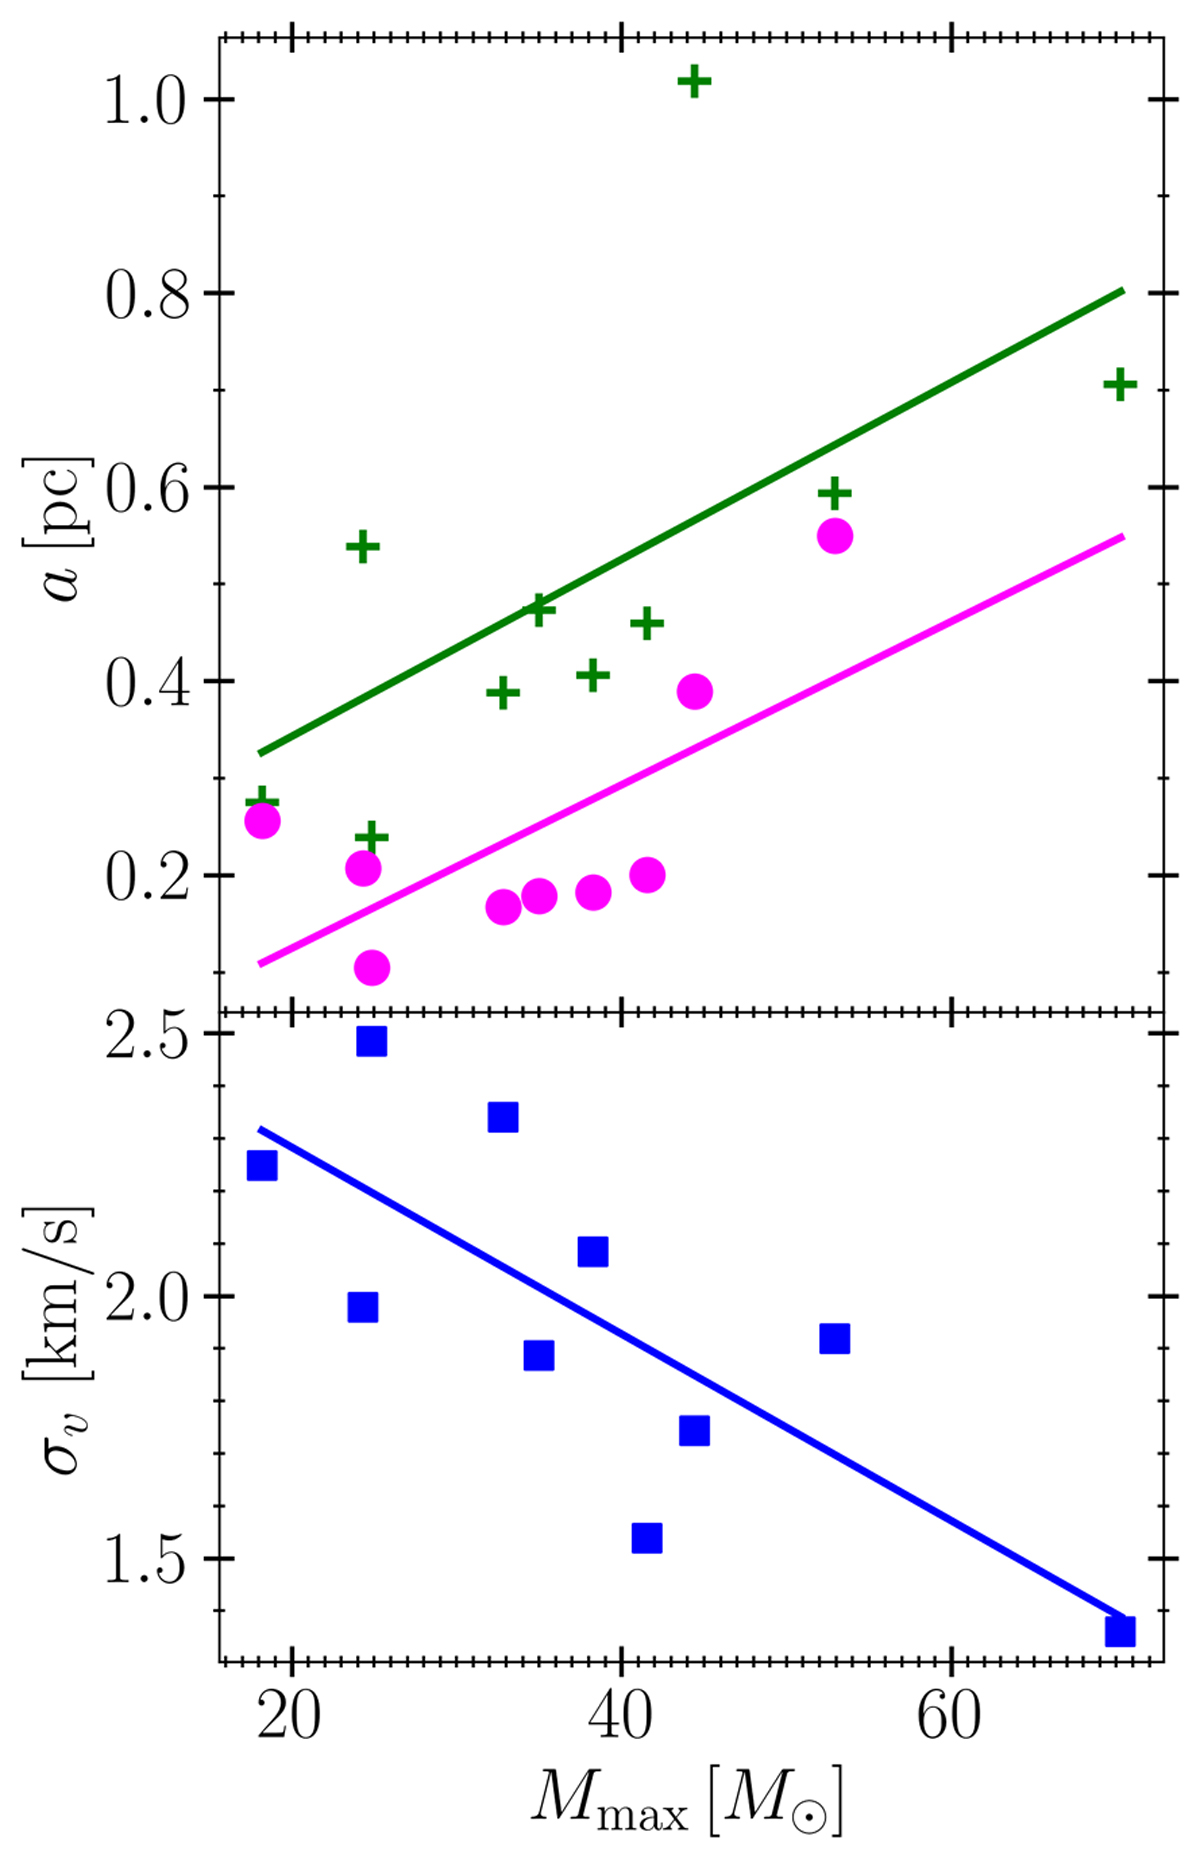
Relationship between the maximum stellar mass (Mmax), the Plummer radius (apl) and the EFF scale radius (aeff) at 4tff, and the velocity dispersion (σv) for simulations at refinement level 3 with different random seeds. All quantities are measured using stars within the radius around the densest region of the cluster that encloses 95% of the total stellar mass. The green line shows a linear fit to apl (plus symbols), given by apl/(1pc) = (0.0091 ± 0.0041)[Mmax/(1 M⊙)] + 0.1608. The magenta line shows a linear fit to aeff (circle symbols), given by aeff/(1 pc) = (0.0084 ± 0.0035)[Mmax/(1 M⊙)] − 0.0437. The blue line shows a linear fit to σv (square symbols), given by σv/(1kms−1) = (−0.017 8 ± 0.0051)[Mmax/(1 M⊙)] + 2.6391. These linear fits are obtained with the linregress function from scipy.stats, which applies ordinary least-squares regression. The upper y-axis corresponds to apl and aeff in parsecs, while the lower y-axis represents σv in km s−1.
Current usage metrics show cumulative count of Article Views (full-text article views including HTML views, PDF and ePub downloads, according to the available data) and Abstracts Views on Vision4Press platform.
Data correspond to usage on the plateform after 2015. The current usage metrics is available 48-96 hours after online publication and is updated daily on week days.
Initial download of the metrics may take a while.