Fig. 2.
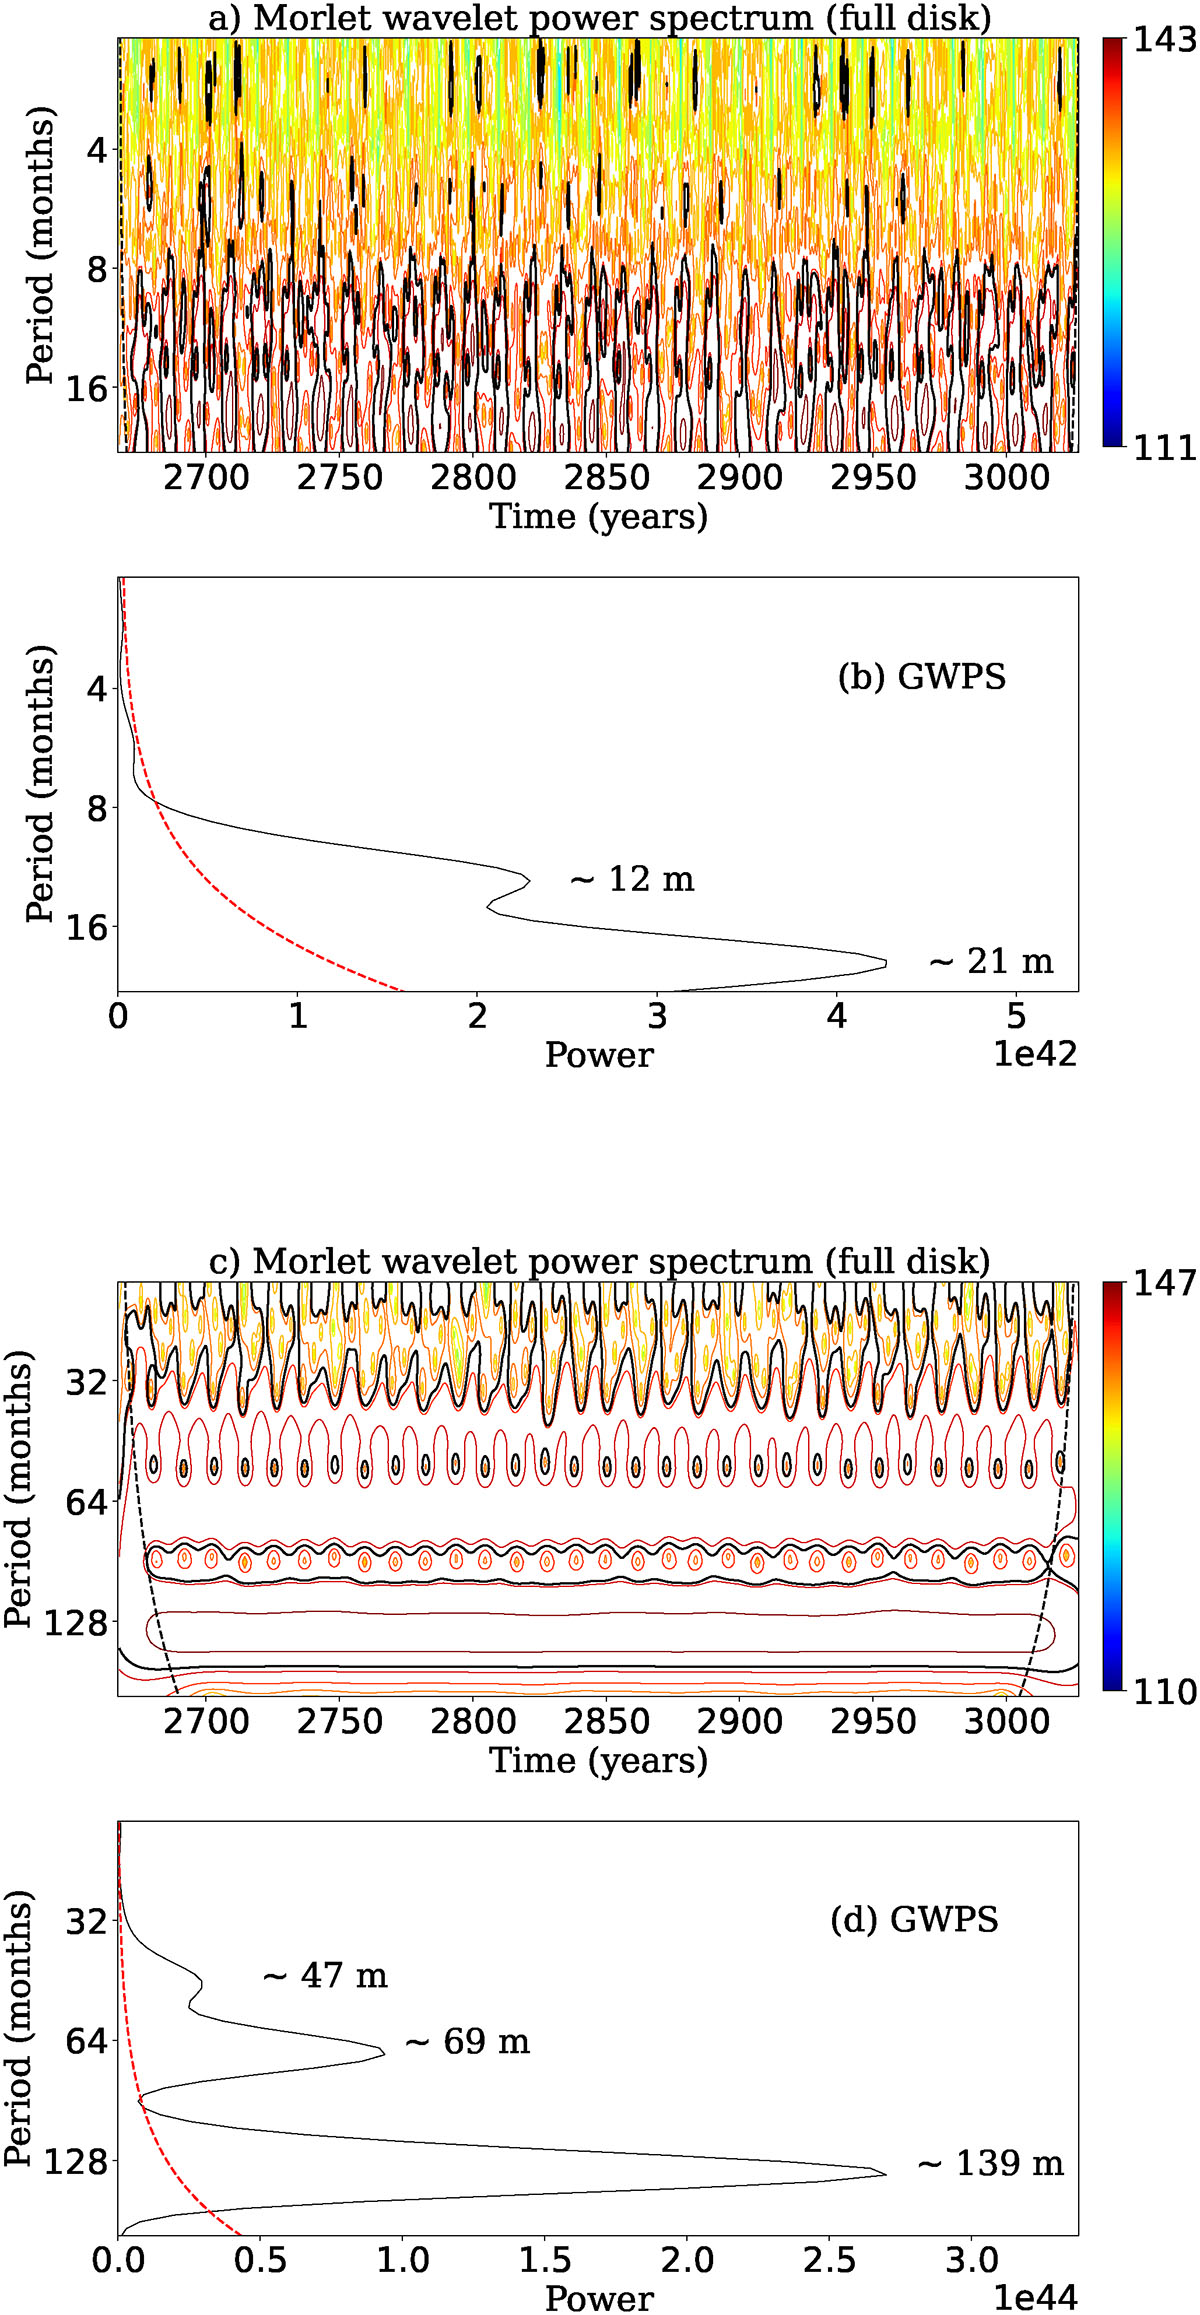
Download original image
Morlet and GWPS of monthly sunspot numbers obtained from the dynamo model with fluctuations in the BMR time delay. Panels (a–b): Short-term or Rieger-type periodicities. Panels (c–d): QBOs and other long-term periods including the main cycle period corresponding to the 11 year solar cycle. The dotted red lines in all GWPS represent the 95% confidence level and black dotted lines in Morlet wavelet spectra represent COI.
Current usage metrics show cumulative count of Article Views (full-text article views including HTML views, PDF and ePub downloads, according to the available data) and Abstracts Views on Vision4Press platform.
Data correspond to usage on the plateform after 2015. The current usage metrics is available 48-96 hours after online publication and is updated daily on week days.
Initial download of the metrics may take a while.