Fig. 3.
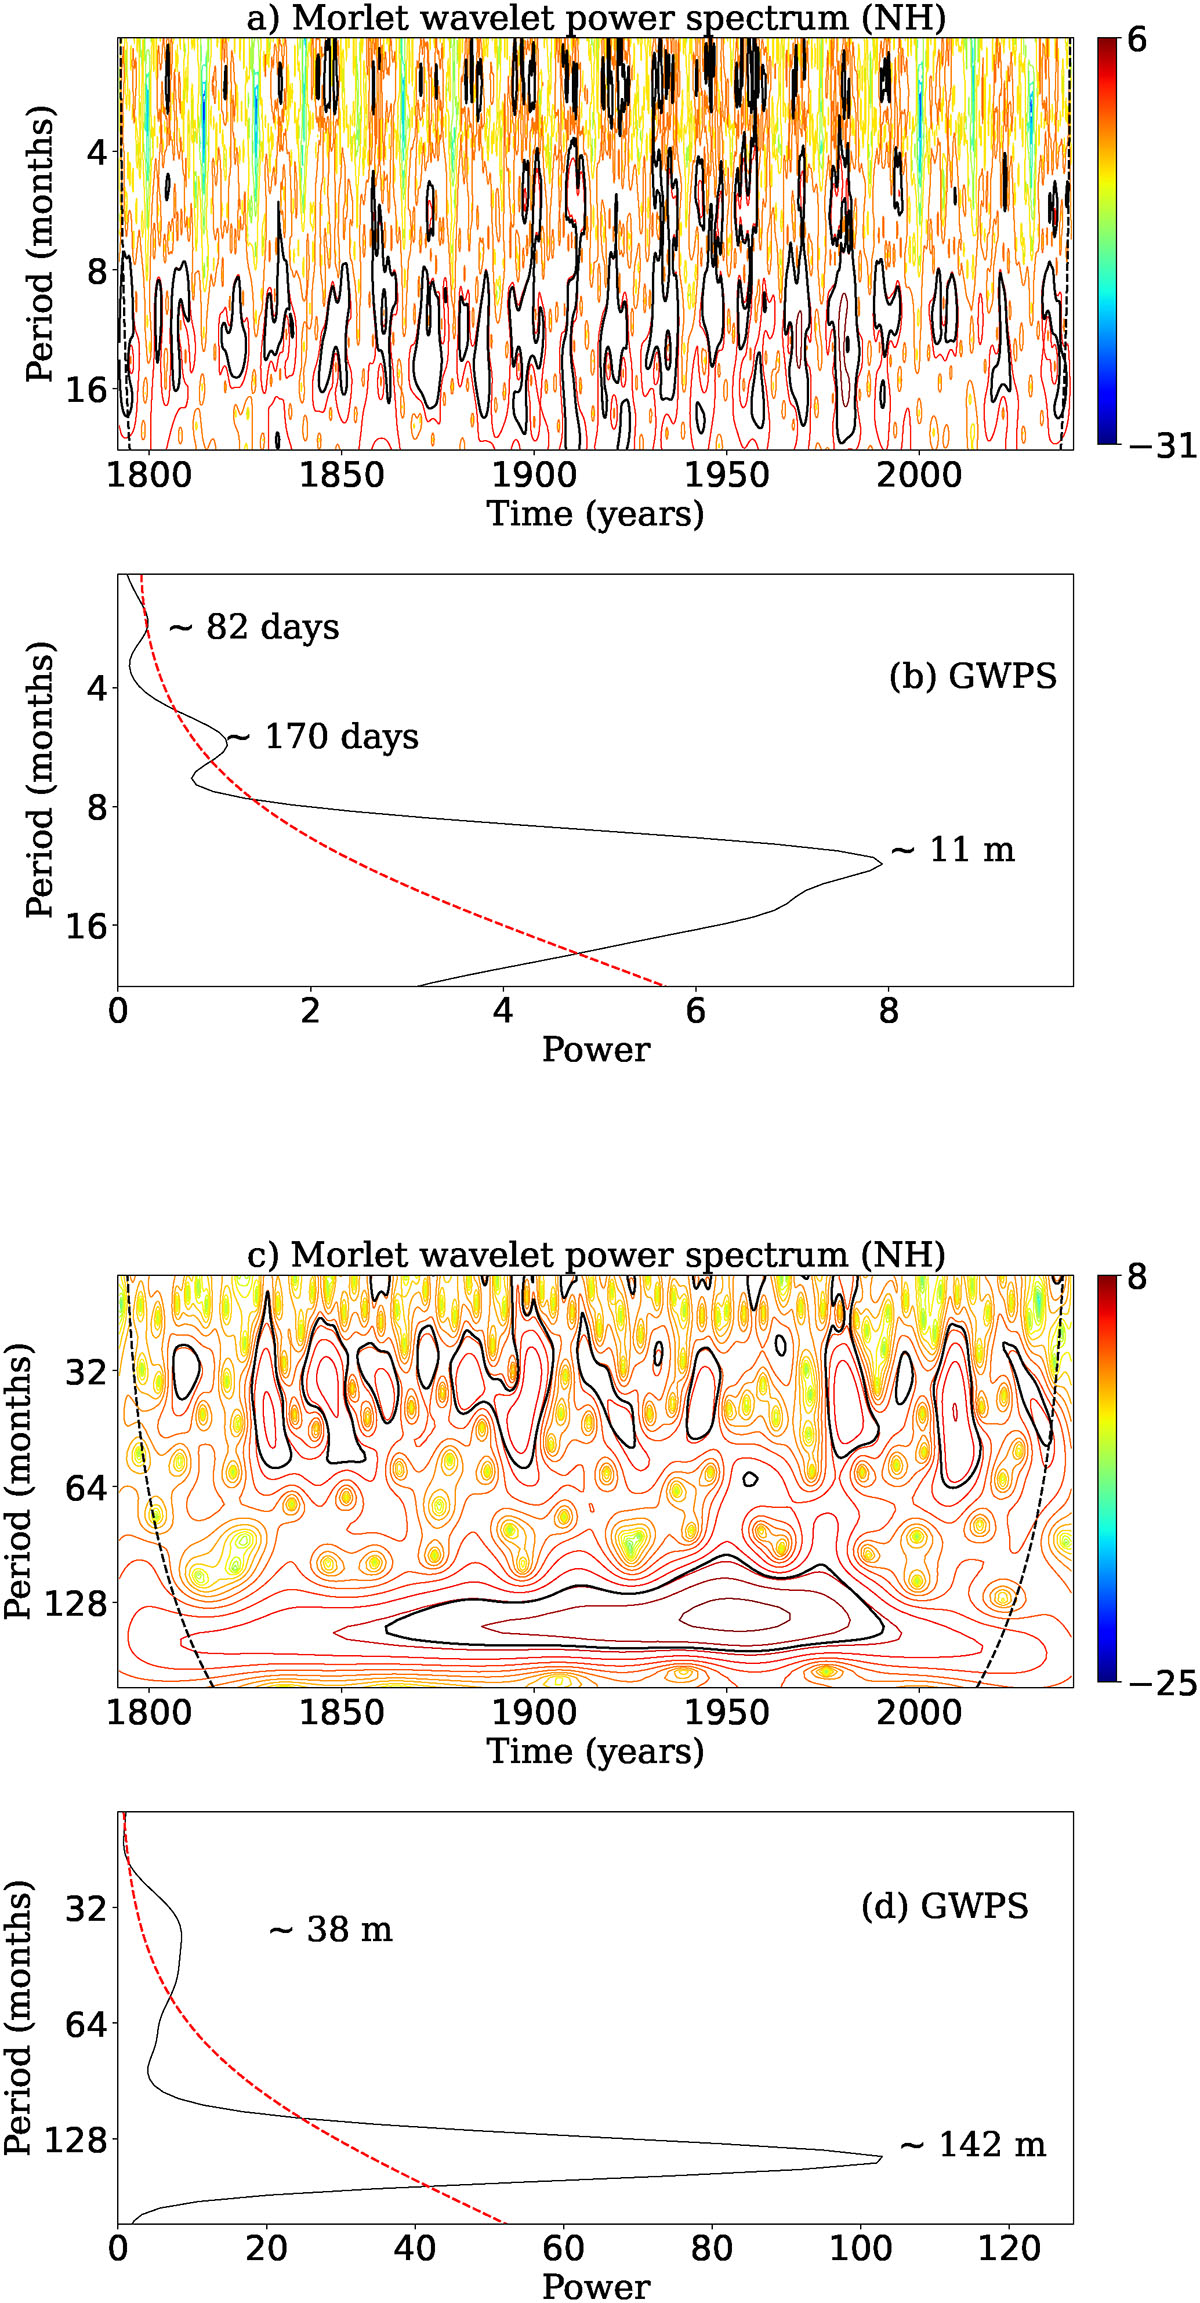
Download original image
Dynamical behavior of various periodicities observed in the northern hemisphere using wavelet power spectra for the monthly sunspot number time series data obtained from the model with fluctuations in all the parameters of the Babcock–Leighton process with a tilt scatter of σδ = 15°. Panel (a): Morlet wavelet spectra used to identify short-term periods (Rieger-type). Panel (b) Global power spectra for short-term periods (Rieger-type). The dotted red line represents a 95% confidence level. Panel (c): Similar to panel (a), but for the QBOs and long-range periods including the cycle corresponding to the 11 year solar cycle. Panel (d): Similar to panel (b), but for the study of QBOs and long periods.
Current usage metrics show cumulative count of Article Views (full-text article views including HTML views, PDF and ePub downloads, according to the available data) and Abstracts Views on Vision4Press platform.
Data correspond to usage on the plateform after 2015. The current usage metrics is available 48-96 hours after online publication and is updated daily on week days.
Initial download of the metrics may take a while.