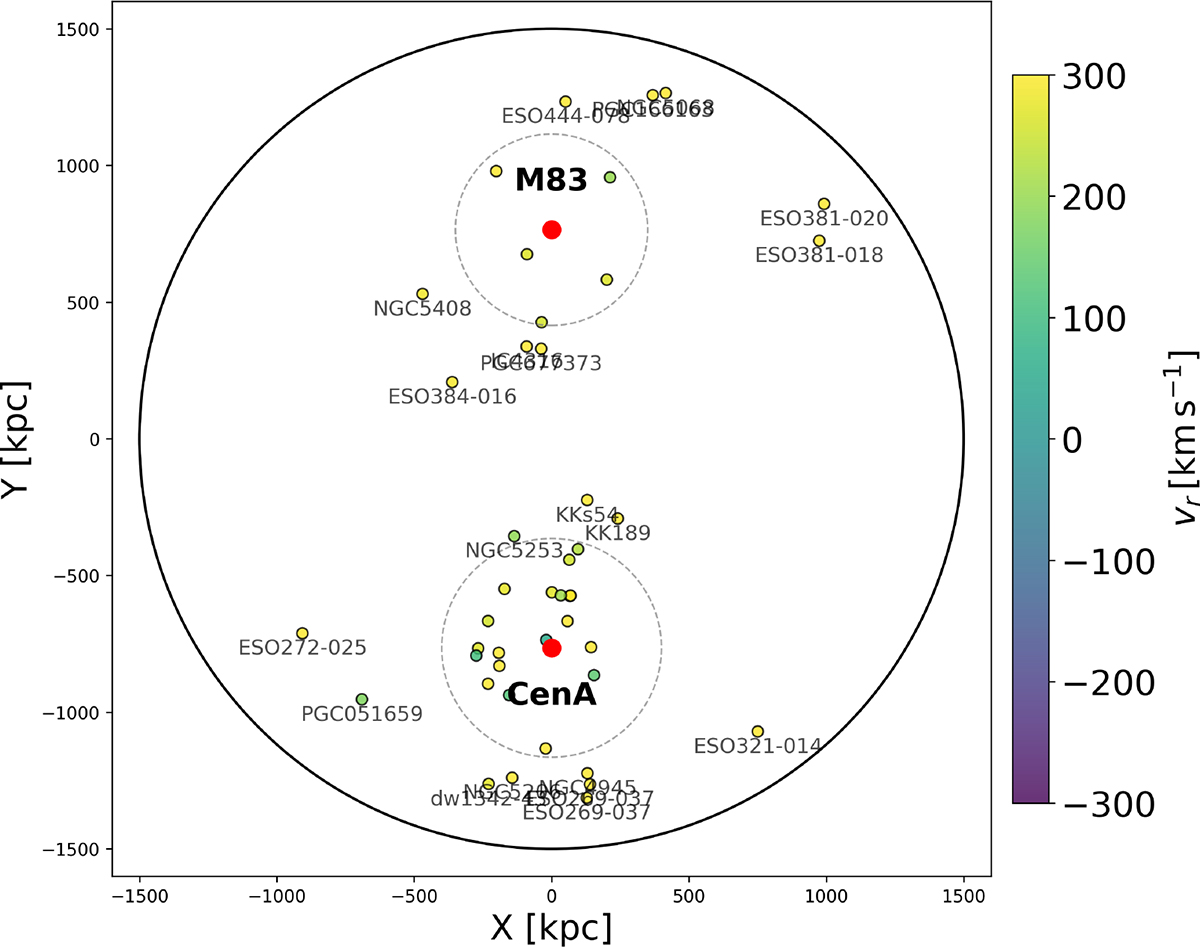
Fig. 1.
Download original image
Spatial distribution of galaxies in CenA – M83 group shown in rotated Cartesian coordinates centred on the midpoint between Cen A and M83. Symbols are colour-coded by heliocentric radial velocity (km s−1). Dashed grey circles indicate the individual virial regions of Cen A and M83, and the black circle marks the 1.5 Mpc zero-velocity surface.
Current usage metrics show cumulative count of Article Views (full-text article views including HTML views, PDF and ePub downloads, according to the available data) and Abstracts Views on Vision4Press platform.
Data correspond to usage on the plateform after 2015. The current usage metrics is available 48-96 hours after online publication and is updated daily on week days.
Initial download of the metrics may take a while.