| Issue |
A&A
Volume 705, January 2026
|
|
|---|---|---|
| Article Number | A112 | |
| Number of page(s) | 7 | |
| Section | Cosmology (including clusters of galaxies) | |
| DOI | https://doi.org/10.1051/0004-6361/202556283 | |
| Published online | 13 January 2026 | |
Hubble-constant and -mass determination of Centaurus A and M83 from tip-of-red-giant-branch distances
1
Institute of Theoretical Astrophysics, University of Oslo 0315 Oslo, Norway
2
École Polytechnique Route de Saclay 91128 Palaiseau, France
3
Leibniz-Institut für Astrophysik Potsdam An der Sternwarte 16 D-14482 Potsdam, Germany
★ Corresponding authors: This email address is being protected from spambots. You need JavaScript enabled to view it.
, This email address is being protected from spambots. You need JavaScript enabled to view it.
Received:
7
July
2025
Accepted:
6
November
2025
Abstract
An independent determination of the Hubble constant is crucial in light of the persistent tension between early- and late-Universe measurements. In this study, we analysed the dynamics of the Centaurus A (CenA) and M83 galaxies, along with their associated dwarf companions identified via tip-of-the-red-giant-branch (TRGB) distance measurements, to constrain both the group mass and the local value of H0. By examining the motions of these galaxies relatively to the system’s barycentre, we applied both the minor and major infall models, which provide bounds on the true radial-velocity dispersion. From the overlap of these approaches, we obtain a virial mass estimate of (7.3 ± 2.0)×1012 M⊙ and a Hubble-flow-based mass of (2.6 ± 1.4)×1012 M⊙. Modeling the cold Hubble flow around the group centre of mass, we derive a corresponding value of the Hubble constant as (64.0 ± 4.6) km s−1 Mpc−1. These results offer an independent, dynamically motivated constraint on the local value of H0, explicitly accounting for the impact of peculiar velocities in the nearby Universe. We also discuss the ∼2σ tension between the virial and Hubble-flow-based mass estimates, which likely arises from the fact that M83 is close to the velocity surface and goes against the Hubble-flow-model assumptions. While the Hubble-flow fit emphasises galaxies that follow smooth expansion on the lower branch of the velocity-distance relation, the virial mass estimate is found to be in good agreement with the group mass derived from the K-band luminosity of its brightest members and the projected mass methods.
Key words: galaxies: groups: general / cosmological parameters
© The Authors 2026
 Open Access article, published by EDP Sciences, under the terms of the Creative Commons Attribution License (https://creativecommons.org/licenses/by/4.0), which permits unrestricted use, distribution, and reproduction in any medium, provided the original work is properly cited.
This article is published in open access under the Subscribe to Open model. This email address is being protected from spambots. You need JavaScript enabled to view it. to support open access publication.
1. Introduction
A long-standing discrepancy persists between measurements of the Hubble constant in the early and late Universe: H0 = 67 km s−1 Mpc−1 as inferred from Planck CMB observations (Planck Collaboration VI 2020), versus H0 = 73 km s−1 Mpc−1 derived from local Cepheid-supernova distance ladders (Perlmutter et al. 1999). This so-called Hubble tension has emerged as one of the most significant challenges in modern cosmology, potentially pointing to unknown systematics or a breakdown in the standard ΛCDM model (Di Valentino et al. 2025; Dainotti et al. 2021, 2025; De Simone et al. 2025). Resolving this tension is crucial, as the value of H0 governs not only the current expansion rate of the Universe, but also its inferred age and ultimate fate. Independent determinations of H0 based on local dynamics offer a complementary test of this discrepancy, free from many of the assumptions underpinning both early- and late-time probes. However, local measurements are complicated by peculiar velocities that arise from the gravitational interactions with nearby mass concentrations. To disentangle these effects from the cosmic expansion, one must account for both the peculiar velocity field and its cosmological context (Pavlidou & Tomaras 2014; Benisty et al. 2023, 2024).
The CenA (NGC 5128) and M83 (NGC 5236) galaxy complex provides a powerful laboratory for investigating local cosmic expansion dynamics, located at distances of 3.8 ± 0.1 Mpc and ∼4.7 Mpc, respectively (Karachentsev et al. 2007; Tully 2015a; Müller et al. 2019). Owing to its intermediate position between virialised structures and the onset of the linear Hubble flow, the CenA/M83 system serves as a valuable testbed for probing gravitational perturbations, infall kinematics, and velocity dispersion with minimised contamination from a large-scale structure. Its well-studied constituents – especially the massive and active CenA – enable precise barycentric modeling grounded in robust observational data.
The system is composed of two dynamically distinct subgroups: a dominant, massive CenA component with a virial mass of [6.4 − 8.1]×1012 M⊙ (Karachentsev et al. 2007), and a less massive M83 sub-group [1.3 − 3]×1012 M⊙ noted for intense star formation and evidence of tidal interactions (Müller et al. 2025). Deep imaging has revealed 16 additional dwarf-galaxy candidates in the M83 sub-group (Müller et al. 2015), whose spatial alignment in a single dominant plane nearly perpendicular to the dust lane of CenA hints at coordinated infall and previous dynamical interactions (Müller et al. 2016), an additional 41 new candidates were found in an expanded survey of 500 sq. deg around the Cen A and M83 sub-groups by Müller et al. (2017).
The system as a whole seems to run away from us with a well-defined zero-velocity surface at 1.40 ± 0.11 Mpc (Karachentsev et al. 2007), indicating the gravitational boundary of the complex. HI observations further reveal extended tidal features and velocity bridges between the galaxies (Müller et al. 2021, 2022), confirming ongoing interactions that influence their orbital evolution. Located on the outskirts of the dominant gravitational centres of the local volume, this research focused on the Hubble flow around CenA/M83 by determining the barycentre of the system and the spread of the galaxies around the local Hubble flow. Recent dynamical models reinforce its transitional nature, showing that flow perturbations decay within this region as the Universe approaches large-scale homogeneity (Müller et al. 2021, 2024, 2025).
An important caveat concerns the kinematics of satellites in the immediate vicinity of Cen A, where most of the dwarf galaxies have been shown to reside in a co-rotating planar structure (Müller et al. 2018, 2021). Since our analysis focuses on galaxies in the surrounding Hubble flow, at distances of approximately [1.5−6] Mpc from the group centre, the co-rotating satellite plane does not directly affect our modelling. This distinction is consistent with previous studies of the LG, where planar satellite distributions around the Milky Way and M31 are acknowledged, but the Hubble-flow analysis relies on the more distant galaxy population (Makarov et al. 2025). As also demonstrated in N-body simulations (Peñarrubia et al. 2014), the large-scale flow at these distances approaches spherical symmetry despite internal anisotropies within virialised regions. We therefore note that while coherent satellite planes are relevant within the virial radius, the present study addresses the dynamics of galaxies at larger scales, where the transition to the local cosmic expansion dominates.
In this paper, we determine the Hubble constant by analysing the peculiar motion of this system. Using tip-of-the-red-giant-branch (TRGB) distances calibrated via the latest distance ladder refinements combined with HI kinematics, we modelled their mutual gravitational interaction and infall trajectory relatively to the Local Group (LG) frame. This approach isolates the peculiar velocity component, enabling direct comparison to the expected Hubble flow at their measured distance and yielding a high-fidelity H0 estimate with minimised local flow contamination. Section 2 describes the observational data sets and the determination and barycentre modelling that underpin our kinematic analysis. Section 3 reports the derived constraints on H0 and the total group mass, including a Bayesian treatment of uncertainties. Finally, Section 4 discusses the implications of these results and summarises our conclusions.
2. Phase-space determination
2.1. The data
In this study, we employed data from several extragalactic catalogs to analyse galaxies within the CenA/M83 galaxy group. Distance measurements are primarily adopted from the Cosmicflows 4 (CF4) catalogue (Tully et al. 2023), which provides TRGB distances independently of any assumption on the Hubble constant. Radial velocities were obtained from the LEDA database that Makarov et al. (2014) accessed via the Extragalactic Distance Database (EDD) (Tully et al. 2009). Additionally, we incorporated velocities and TRGB distances from recent studies of dwarf galaxies in the Cen A and M83 groups (Müller et al. 2021, 2025), which also provide TRGB distances. Radial velocities obtained from LEDA are initially in the geocentric frame and are corrected to the LG frame (Karachentsev & Makarov 1996). Distances across all datasets are based on TRGB determinations, ensuring consistency and independence from redshift-based methodologies. Consequently, we were able to accurately reconstruct the spatial and kinematic structure of the CenA/M83 group, free from biases introduced by cosmic-expansion assumptions. Fig. 1 shows the spatial distribution of the galaxies. Our sample selection only includes galaxies that have both distance and radial-velocity measurements with associated uncertainties and that lie close to the inferred barycentre of the CenA/M83 system. As we later assumed that the barycentre lies along the line connecting Cen A and M83, we initially selected all galaxies within 10 Mpc of either Cen A or M83. This yields a final sample of 135 galaxies from the EDD and 22 additional galaxies from recent studies. The selected galaxies span distances from 0.9 Mpc to 14.7 Mpc and have LG frame velocities ranging from −10 km s−1 to 1300 km s−1.
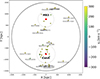 |
Fig. 1. Spatial distribution of galaxies in CenA – M83 group shown in rotated Cartesian coordinates centred on the midpoint between Cen A and M83. Symbols are colour-coded by heliocentric radial velocity (km s−1). Dashed grey circles indicate the individual virial regions of Cen A and M83, and the black circle marks the 1.5 Mpc zero-velocity surface. |
2.2. Barycentre determination
To analyse the dynamics of galaxy pairs within the CenA/M83 system, we transformed observed velocities into the barycentre frame. Observational constraints limited velocity measurements to the line-of-sight (LoS) components. Consequently, we required dynamical models to estimate radial infall velocities relatively to the CenA/M83 barycentre. We adopted the following two limiting cases (Karachentsev & Kashibadze 2006; Wagner & Benisty 2025).
-
The minor-infall model assumes negligible transverse velocities (v⊥, c = v⊥, j = 0). The radial infall velocity for galaxy j relative to the centre of mass (CoM) (c) is
 (1)
(1)This symmetric treatment minimises peculiar velocity contributions, representing the most probable scenario when transverse motions are sub-dominant.
-
The major-infall model assumes zero transverse Center of Mass (CoM) velocity and negligible galaxy tangential velocity (v⊥, c = vtan = 0). The infall velocity becomes
 (2)
(2)Note that for this model, galaxies located very close to the CoM can make the denominator arbitrarily small, resulting in non-physical velocity values. In all subsequent analyses, these galaxies are excluded. As shown in Wagner & Benisty (2025), Benisty & Mota (2025), the minor infall statistically underestimates the true radial velocity, and the major infall overestimates the radial velocity.
Understanding the motion of galaxies within the group requires careful modelling of their velocity field. The analysis begins by transforming the observed heliocentric velocities into a reference frame of LG (Karachentsev & Makarov 1996). We assume that the dynamical centre lies along the axis connecting the CenA and M83 halos, with its exact position determined by their mass ratio (see Fig. 2). Similarly to Ref. Karachentsev et al. (2009), we parameterised the barycentre velocity, vc, using the mass ratio  :
:
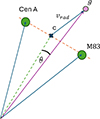 |
Fig. 2. Schematic illustration of barycentre (c) determination along the line connecting the CenA and M83 galaxies. For a given dwarf galaxy (g), the radial velocity is estimated using either the minor- or major-infall model. The barycentre is identified by minimising the velocity dispersion of the radial velocities towards the barycentre. θ is the angle between galaxy (g) and the centre (c). |
 (3)
(3)
where  represents the fractional mass contribution of CenA relative to the total mass of the system; we then projected this velocity on the barycentre LoS vector to obtain the LoS velocity. This formulation allowed us to explore the kinematic structure across possible mass ratios:
  corresponds to a CenA-centred frame, while
  gives an M83-centred frame.
The determination of the barycentre position requires a fixed set of galaxies with a position and velocities that are always usable. So, the galaxies used for this analysis are those that are closer than 3 Mpc from the barycentre and have |Δvr|< 500 km s−1 for all possible barycentres (the second restriction excludes galaxies with non-physical velocities).
For each trial mass ratio, we computed minor and major infall velocities relatively to the CoM and evaluated the velocity dispersion  for selected galaxies. The optimal
  minimises this dispersion, identifying the most stable dynamical frame. Fig. 3 shows
  as a function of
  , revealing distinct minima for both infall models: the major infall model curve gives the minimum at
  , which gives a distance from us of rc = 3.95 Mpc and a velocity from the LG CoM of vc = 302 km s−1, and the minor-infall-model curve gives the minimum at
  , which gives a distance from us of rc = 3.80 Mpc and a velocity from the LG CoM of vc = 304 km s−1. This kinematic minimisation provides a model-dependent mass-ratio estimate independent of luminosity-based methods. The difference between models reflects systematic uncertainties in the assumptions of transverse velocity, which we propagate into our H0 constraints.
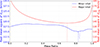 |
Fig. 3. Root mean square of the relative velocity dispersion, |


3. Parameter determination
3.1. Hubble-flow fit
A fundamental tool for analysing these systems is the velocity-distance relationship. Sandage (1986) introduced a method to estimate the mass of galaxy systems using this relationship, which encapsulates the kinematic state of the system. By measuring velocities and distances of member galaxies, one can estimate both the total mass of the system and the Hubble constant through non-linear fitting techniques (Teerikorpi & Chernin 2010). This method has been applied to groups and clusters (Peirani & de Freitas Pacheco 2006; Peirani & Pacheco 2008; Del Popolo & Chan 2022; Kim et al. 2020; Peñarrubia et al. 2014; Nasonova et al. 2011; Benisty et al. 2025; Benisty 2025; Wagner et al. 2025). The concept of turnaround, where gravitational attraction balances cosmic expansion, has been proposed as a stringent test of the ΛCDM cosmological model (Pavlidou & Tomaras 2014; Tanoglidis et al. 2015; Pavlidou et al. 2014, 2020; Paraskevas & Perivolaropoulos 2024). The Hubble flow around the LG has been particularly informative to studies of the dynamics of dwarf galaxies relative to cosmic expansion (Karachentsev et al. 2009). We modelled the interplay between gravitational collapse and cosmic expansion through a non-linear fit to CenA/M83 kinematics via the relation from Peñarrubia et al. (2014):
 (4)
(4)
with ΩΛ = 0.67. Our framework incorporates the zero-gravity radius demarcating bound and unbound regions (Teerikorpi & Chernin 2010), dark-energy effects via the cosmological constant (Peirani & Pacheco 2008; Del Popolo & Chan 2022), and turnaround radius tests of ΛCDM cosmology as Pavlidou & Tomaras (2014), Tanoglidis et al. (2015) claimed.
We selected fitted galaxies as those lying between [1.40, 6] Mpc from the CoM, within the Hubble-flow velocity range. The inner limit of 1.40 Mpc corresponds to the zero-velocity radius from (Karachentsev et al. 2007); galaxies inside this radius are not expected to follow the Hubble law. The outer limit of 6 Mpc is imposed, because beyond this scale other large-scale structures may significantly influence galaxy kinematics. For a better Mgroup estimate, we also added a few galaxies with r < 1.40 Mpc, which fall towards the CoM (r < 1.40 Mpc and vr < −100 km s−1). Galaxies with uncertainty estimates under 10% for velocity and 100% for distance were not used. We fitted the velocity-distance relation using a Bayesian approach. The likelihood of observing galaxies at given distances, ri, from the CenA-M83 group CoM, with radial velocities of ri, the parameters H0 and M, and the intrinsic velocity dispersion δI is
 (5)
(5)
here,  . Additionally, err(vi) and err(ri) are measurement errors, and δI is the intrinsic velocity dispersion interpreted as scatter from peculiar motion.
We employed the emcee sampler (Foreman-Mackey et al. 2013) to explore the posterior distributions of key model parameters, as illustrated in Fig. 5. These include the Hubble constant H0, the group mass Mgroup, and the intrinsic velocity dispersion δI. For the minor-infall model, the analysis yields  km s−1 Mpc−1,
  , and
, and  km s−1. In contrast, the major-infall model gives a slightly higher Hubble constant of
  km s−1 Mpc−1, a larger group mass of
  , and a higher intrinsic velocity dispersion of
  km s−1.
These results highlight subtle but important differences between the two models. The minor-infall model tends to underestimate H0, while the major-infall model tends to overestimate it. Moreover, radial trends shown in Fig. 4 reveal three key features: H0 estimates stabilise beyond ∼1.5 Mpc, where the Hubble flow dominates; mass estimates converge within r < 0.8 Mpc, where virial equilibrium is expected to hold; the systematic offset in H0 between models reflects differing assumptions about the nature of galaxy infall. The 2σ overlapping the models gives
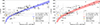 |
Fig. 4. Radial-velocity versus 3D distance from the group barycentre for the minor (left) and the major (right) infall models. The Muse galaxies are shown in green, and the galaxies used for the fit are shown in black. The Hubble-flow-fit model is presented with a 3σ error. |

and

which we adopted as the best combined values accounting for the bias introduced by different infall assumptions. However, the approach used to fit H0 and Mgroup is not exact; this is due to the fact that the independent variable, r, is itself subject to measurement error – a phenomenon known as regression dilution bias. A more accurate formulation of the likelihood function is given by
![Mathematical equation: $$ \begin{aligned} p(v|r,H_0,M,\delta _I) = -\sum _{i} \bigg [\frac{(y_i - v_i)^2}{2(\delta _I^2 + \mathrm{err}(v_i)^2)}&+ \frac{(x_i - r_i)^2}{2\,\mathrm{err}(r_i)^2}\bigg ]\nonumber \\&+ \ln (2\pi \sigma _i^2), \end{aligned} $$](/articles/aa/full_html/2026/01/aa56283-25/aa56283-25-eq31.gif) (6)
(6)
where (xi, yi) is the orthogonal projection of the observed data point (ri, vi) onto the model curve y = fH0, M(x). Although the previous likelihood expression was similar to the standard form, χ2, used in least-squares regression, the above formulation corresponds to the Deming regression method, which accounts for uncertainties in both variables.
Implementing this likelihood in a Markov chain Monte Carlo (MCMC) sampler cannot directly fit for δI. To approximate its effect, we artificially inflated the velocity uncertainties by adding the intrinsic dispersions obtained from the MCMC fit: δImin = 68.1 km s−1 for the minor-infall model and δImaj = 98.4 km s−1 for the major-infall model. Using this approximation, we obtain H0 = 63.8 ± 3.9 km s−1 Mpc−1 and Mgroup = 1.81 ± 0.84 × 10¹² M⊙ for the minor infall case, and H0 = 68.1 ± 5.2 km s−1 Mpc−1 with Mgroup = 3.05 ± 1.55 × 10¹² M⊙ for the major-infall case.
These results are consistent with those obtained from the complete posterior MCMC procedure, confirming that the inclusion of δI dominates the uncertainty budget and effectively justifies the use of a least-squares approximation as a proxy for orthogonal distance regression (ODR). A key advantage of the Bayesian framework is its capacity to incorporate observational uncertainties and prior information in a coherent, principled manner. However, assumptions regarding the functional form of intrinsic velocity dispersion and the symmetric treatment of distance and velocity errors may introduce subtle biases. Future work could explore hierarchical Bayesian models or Gaussian process regression to more flexibly account for these effects and better characterise the local velocity field.
We also tested different values of the selection radii, with rmin ∈ [0.5 Mpc, 3 Mpc] and rmax ∈ [5 Mpc, 7 Mpc], which define the radial range of galaxies used for the Hubble-law fitting. This allowed us to assess the impact of galaxy selection on the fitted parameters H0 and Mgroup. The results are shown in Fig. 6. When the minimum radius decreases below the zero-velocity surface, an increasing number of galaxies that do not follow the Hubble flow –because of the internal dynamics within the bound region –are included in the fit. Similarly, when the maximum radius exceeds 6 Mpc, more galaxies deviate from the Hubble law due to motions induced by other large-scale structures.
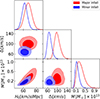 |
Fig. 5. Posterior distributions for Hubble constant, H0; the group mass, M [1012 ⊙ ]; and intrinsic velocity dispersion, δI [km/s]. The blue contour shows the minor-infall model, while the red one shows major-infall posterior. |
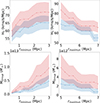 |
Fig. 6. Dependence of fitted Hubble constant (H0) and group mass (Mgroup) on the choice of minimum and maximum selection radii. The blue curves correspond to the minor-infall model, and the red curves correspond to the major-infall model. The coloured area corresponds to the 1σ uncertainty on the results. Top panels: Fitted values of H0. Bottom panels: Fitted values of Mgroup. Left: Variation of H0 and Mgroup as function of minimum radius, rminimum, used on selected galaxies for the fit. In these cases, the maximum radius was fixed at 6 Mpc, and galaxies close to the CoM and apparently infalling towards it were kept. Right: Variation of H0 and Mgroup as function of maximum radius, rmaximum. Here, the minimum radius was fixed at 1.4 Mpc, and nearby galaxies infalling towards the CoM were kept. |
3.2. Virial mass
Assuming that the core of the CenA-M83 system encompasses galaxies within the velocity surface around the barycentre, we calculated the virial mass (Limber & Mathews 1960; Bahcall & Tremaine 1981; Heisler et al. 1985; An & Evans 2011; Tully 2015a; Benisty et al. 2024):
 (7)
(7)
where rG runs over all of the dwarf galaxies towards the main halo. In the case of two main halos (CenA and M83), the harmonic radius is modified to be  . σv represents the velocity dispersion of galaxies in the core, rG denotes the harmonic mean of 3D pairwise distances between the N galaxies (weighted by their inverse separations rij), and α is a dimensionless geometrical factor that depends on the dark-matter distribution and velocity anisotropy.
For reference, α = 3 corresponds to isotropic orbits in an isothermal sphere, α = 2.6 to isotropic velocities in an Navarro–Frenk–White (NFW) profile, and α = 2.4 to specific anisotropy models (Limber & Mathews 1960; Bahcall & Tremaine 1981). To encompass uncertainties in the dark-matter distribution, we adopted a broad uniform prior of α ∈ [2, 4]. We adapted the area up to the velocity surface. We used a Gaussian prior on the velocities and our distances. The velocity dispersion for galaxies in the virial core is 103 ± 3 km/s. Substituting these results into Eq. (7), we give the overall mass as
 (8)
(8)
3.3. K-band luminosity mass
We can use the luminosity of the main galaxies to infer the total mass of the group. Following Tully (2015b), we estimated group masses using the empirical K-band luminosity-to-mass relation calibrated against the virial masses of groups, which provides a robust total mass estimate independent of the stellar initial-mass function assumptions. The relation reads
 (9)
(9)
where LK is the luminosity of 2MASS Ks. This relation implies a mass-to-light ratio
 (10)
(10)
which is fixed at M/LK = 43 M⊙/L⊙ for LK ≤ 1010 L⊙ and at M/LK = 121 M⊙/L⊙ for LK ≥ 1013 L⊙. Between these luminosity limits, the power-law captures the trend observed in nearby groups from numerical-action modelling and other studies. Systems dominated by elliptical galaxies carry roughly 25% more mass per unit, Ks, of light than spiral-dominated systems, and the overall uncertainty in the luminosity-to-mass conversion is about 20% (Tully 2015b). Adopting h = 0.7 ± 0.1 and the 2MASS luminosities – LK, CenA = 7.8 × 10¹⁰ L⊙ and LK, M83 = 7.2 × 10¹⁰ L⊙ – from Karachentsev & Kashibadze (2021) (summarised in Table 1), we find MCenA = (3.97 ± 0.98)×1012 M⊙ and MM83 = (2.93 ± 0.72)×1012 M⊙, where the CenA mass includes the 25% elliptical correction. The total mass of the combined system is
 (11)
(11)
K-band luminosity data from Karachentsev & Kashibadze (2021).
These estimates assume the group mass prescription is valid in the luminosity interval considered. The quoted uncertainties reflect contributions from both the adopted value of h and the intrinsic 20% scatter in the luminosity-to-mass relation, but they do not include other potential sources of error such as distance uncertainties, internal extinction corrections, dynamical disturbances, or variations in the stellar initial-mass function.
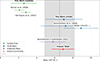 |
Fig. 7. Comparison of CenA/M83 galaxy-group mass estimates obtained in this work with other recent estimates taken from Peirani & Pacheco (2008), Karachentsev et al. (2007), Müller et al. (2019, 2025), Karachentsev & Kashibadze (2021), Del Popolo et al. (2021). An overall estimate with (6.53 ± 1.66)×1012 M⊙ is added as a grey zone. |
4. Discussion
Our analysis provides an independent, dynamical estimate of the Hubble constant and total group mass of the CenA/M83 system, using both the minor- and major-infall models to bracket the impact of unknown transverse motions. The values we derive for the Hubble constant range from  km s−1 Mpc−1 (minor infall) to
  km s−1 Mpc−1 (major infall), with a total value of H0 = 64.0 ± 4.6 km s−1 Mpc−1. These values are consistent with, but systematically lower than, recent late-Universe measurements based on Cepheid-calibrated supernovae (e.g. H0 ≈ 73 km s−1 Mpc−1), and they are closer to early-Universe determinations from the CMB (e.g. H0 ≈ 67.4 km s−1 Mpc−1 from Planck Collaboration VI 2020). These findings highlight the importance of local dynamical effects in reconciling discrepancies in H0 measurements. The significant peculiar velocities observed in the Local Volume complicate direct extrapolation of redshifts to infer the Hubble flow, especially within ∼5 Mpc.
The spread between the two infall models illustrates the systematic uncertainty arising from the unknown tangential velocities. The minor-infall model assumes purely radial motion and likely underestimates the total infall velocity, thus producing a lower Hubble constant and smaller group mass. In contrast, the major infall model assumes more concentrated motion along the line of sight and provides an upper bound. Our results suggest that the true values likely lie between these extremes. The posterior distributions show consistent correlations between Hubble constant, group mass, and intrinsic dispersion, underscoring how LG dynamics imprint on the observed Hubble flow.
A recent analysis based on the CF4 catalog (Tully et al. 2023; Duangchan et al. 2025) infers H0 = 74.6 ± 0.8 km s−1 Mpc−1, a value higher than ours. This offset can be traced to several factors. First, the CF4 distance scale ties together multiple indicators (Tully-Fisher, Fundamental Plane, surface-brightness fluctuations, and others) and is calibrated assuming a particular adopted value of the Hubble constant, whereas our distance ladder uses TRGB distances that are independent of H0. Second, the treatment of peculiar velocities and bulk flows differs: CF4 analyses and ours weight nearby objects differently, and because peculiar motions constitute a larger fraction of the observed redshift at small distances, the inferred expansion rate is especially sensitive to flow modeling and sky coverage. Third, selection and sample-correction procedures differ between the studies. Because peculiar-velocity corrections directly affect the measured dispersion and thus the derived expansion rate, analyses that rely more heavily on the very Local Volume are particularly vulnerable to under- or over-estimates arising from flow modelling.
In addition to the Hubble constant, we derive two independent estimates of the total mass of the CenA/M83 system. From the Hubble-flow model, we obtain MHubble = (2.6 ± 1.4)×1012 M⊙. This value agrees with earlier CenA estimates, but it is notably lower than our virial result of Mvir = (7 ± 2)×1012 M⊙, which includes the full velocity dispersion of galaxies within the turnaround radius. Therefore, there is a tension between the virial and the K-band masses and Hubble-flow determinations. Fig. 7 compares our virial estimate with previous virial results (Müller et al. 2019, 2025), Hubble-flow fits (Del Popolo et al. 2021; Del Popolo & Chan 2022), K-band luminosity estimates (Tully 2015b), and projected mass (Karachentsev & Kashibadze 2021). An overall estimate of the mass without the lower Hubble flow gives (6.53 ± 1.66)×1012 M⊙.
The lower Hubble-flow mass is expected, because the Hubble-flow-mass method assumes a single concentrated mass and treats each satellite as a test particle that has moved outward with zero peculiar velocity since the Big Bang. Such an approximation is valid only when satellites lie far enough from the main halo to feel its gravity as if it were a point mass. For example, in the Milky Way-M31 system, the satellites are sufficiently distant that a clean, cold Hubble flow is observed, and the method performs well (Karachentsev et al. 2009; Makarov et al. 2025).
In contrast, for CenA/M83 the situation is different: as Fig. 4 shows, M83 lies close to the system’s velocity surface, so the assumption of a single isolated point mass is violated. The proximity of M83 and its interaction with CenA introduce internal dynamics that the simple Hubble-flow model cannot capture, which naturally results in a lower total mass. Therefore, we place greater weight on the virial estimate, which more fully reflects the true dynamical state of the system.
Data availability
The data are available at the CDS via https://cdsarc.cds.unistra.fr/viz-bin/cat/J/A+A/705/A112
Acknowledgments
We thank Igor Karachentsev for useful discussions and comments. DB is supported by a Minerva Fellowship of the Minerva Stiftung Gesellschaft für die Forschung mbH. DFM thanks the Research Council of Norway for their support and the resources provided by UNINETT Sigma2 – the National Infrastructure for High-Performance Computing and Data Storage in Norway. This article is based on work from the COST Action CA21136 – “Addressing observational tensions in cosmology with systematics and fundamental physics” (CosmoVerse) and the Cost Action CA23130 – Bridging high and low energies in search of quantum gravity (BridgeQG), supported by COST (European Cooperation in Science and Technology).
References
- An, J. H., & Evans, N. W. 2011, MNRAS, 413, 1744 [Google Scholar]
- Bahcall, J. N., & Tremaine, S. 1981, ApJ, 244, 805 [Google Scholar]
- Benisty, D. 2025, Phys. Rev. D, 112, 083557 [Google Scholar]
- Benisty, D., & Mota, D. 2025, A&A, 698, A43 [NASA ADS] [CrossRef] [EDP Sciences] [Google Scholar]
- Benisty, D., Davis, A.-C., & Evans, N. W. 2023, ApJ, 953, L2 [NASA ADS] [CrossRef] [Google Scholar]
- Benisty, D., Chaichian, M. M., & Tureanu, A. 2024, Phys. Lett. B, 858, 139033 [Google Scholar]
- Benisty, D., Wagner, J., Haridasu, S., & Salucci, P. 2025, ArXiv e-prints [arXiv:2504.04135] [Google Scholar]
- Dainotti, M. G., De Simone, B., Schiavone, T., et al. 2021, ApJ, 912, 150 [NASA ADS] [CrossRef] [Google Scholar]
- Dainotti, M. G., De Simone, B., Garg, A., et al. 2025, J. High Energy Astrophys., 48, 100405 [Google Scholar]
- De Simone, B., van Putten, M. H. P. M., Dainotti, M. G., & Lambiase, G. 2025, J. High Energy Astrophys., 45, 290 [Google Scholar]
- Del Popolo, A., & Chan, M. H. 2022, ApJ, 926, 156 [NASA ADS] [CrossRef] [Google Scholar]
- Del Popolo, A., Deliyergiyev, M., & Chan, M. H. 2021, Phys. Dark Univ., 31, 100780 [Google Scholar]
- Di Valentino, E., Said, J. L., Riess, A., et al. 2025, Phys. Dark Univ., 49, 101965 [Google Scholar]
- Duangchan, C., Valade, A., Libeskind, N. I., & Steinmetz, M. 2025, A&A, submitted [arXiv:2507.22236] [Google Scholar]
- Foreman-Mackey, D., Hogg, D. W., Lang, D., & Goodman, J. 2013, PASP, 125, 306 [Google Scholar]
- Heisler, J., Tremaine, S., & Bahcall, J. N. 1985, ApJ, 298, 8 [CrossRef] [Google Scholar]
- Karachentsev, I. D., & Kashibadze, O. G. 2006, Astrophysics, 49, 3 [NASA ADS] [CrossRef] [Google Scholar]
- Karachentsev, I., & Kashibadze, O. 2021, Astron. Nachr., 342, 999 [NASA ADS] [CrossRef] [Google Scholar]
- Karachentsev, I. D., & Makarov, D. A. 1996, AJ, 111, 794 [NASA ADS] [CrossRef] [Google Scholar]
- Karachentsev, I. D., Tully, R. B., Dolphin, A., et al. 2007, AJ, 133, 504 [NASA ADS] [CrossRef] [Google Scholar]
- Karachentsev, I. D., Kashibadze, O. G., Makarov, D. I., & Tully, R. B. 2009, MNRAS, 393, 1265 [NASA ADS] [CrossRef] [Google Scholar]
- Kim, Y. J., Kang, J., Lee, M. G., & Jang, I. S. 2020, ApJ, 905, 104 [NASA ADS] [CrossRef] [Google Scholar]
- Limber, D. N., & Mathews, W. G. 1960, ApJ, 132, 286 [NASA ADS] [CrossRef] [Google Scholar]
- Makarov, D., Prugniel, P., Terekhova, N., Courtois, H., & Vauglin, I. 2014, A&A, 570, A13 [NASA ADS] [CrossRef] [EDP Sciences] [Google Scholar]
- Makarov, D., Makarov, D., Makarova, L., & Libeskind, N. 2025, A&A, 698, A178 [NASA ADS] [CrossRef] [EDP Sciences] [Google Scholar]
- Müller, O., Jerjen, H., & Binggeli, B. 2015, A&A, 583, A79 [NASA ADS] [CrossRef] [EDP Sciences] [Google Scholar]
- Müller, O., Jerjen, H., Pawlowski, M. S., & Binggeli, B. 2016, A&A, 595, A119 [NASA ADS] [CrossRef] [EDP Sciences] [Google Scholar]
- Müller, O., Jerjen, H., & Binggeli, B. 2017, A&A, 597, A7 [NASA ADS] [CrossRef] [EDP Sciences] [Google Scholar]
- Müller, O., Pawlowski, M. S., Jerjen, H., & Lelli, F. 2018, Science, 359, 534 [CrossRef] [Google Scholar]
- Müller, O., Rejkuba, M., Pawlowski, M. S., et al. 2019, A&A, 629, A18 [Google Scholar]
- Müller, O., Fahrion, K., Rejkuba, M., et al. 2021, A&A, 645, A92 [NASA ADS] [CrossRef] [EDP Sciences] [Google Scholar]
- Müller, O., Pawlowski, M. S., Lelli, F., et al. 2021, A&A, 645, L5 [NASA ADS] [CrossRef] [EDP Sciences] [Google Scholar]
- Müller, O., Lelli, F., Famaey, B., et al. 2022, A&A, 662, A57 [NASA ADS] [CrossRef] [EDP Sciences] [Google Scholar]
- Müller, O., Pawlowski, M. S., Revaz, Y., et al. 2024, A&A, 684, L6 [NASA ADS] [CrossRef] [EDP Sciences] [Google Scholar]
- Müller, O., Rejkuba, M., Fahrion, K., et al. 2025, A&A, 699, A207 [NASA ADS] [CrossRef] [EDP Sciences] [Google Scholar]
- Nasonova, O. G., de Freitas Pacheco, J. A., & Karachentsev, I. D. 2011, A&A, 532, A104 [NASA ADS] [CrossRef] [EDP Sciences] [Google Scholar]
- Paraskevas, E. A., & Perivolaropoulos, L. 2024, MNRAS, 531, 1021 [Google Scholar]
- Pavlidou, V., & Tomaras, T. N. 2014, JCAP, 09, 020 [CrossRef] [Google Scholar]
- Pavlidou, V., Tetradis, N., & Tomaras, T. N. 2014, JCAP, 05, 017 [CrossRef] [Google Scholar]
- Pavlidou, V., Korkidis, G., Tomaras, T., & Tanoglidis, D. 2020, A&A, 638, L8 [NASA ADS] [CrossRef] [EDP Sciences] [Google Scholar]
- Peirani, S., & de Freitas Pacheco, J. A. 2006, New Astron., 11, 325 [NASA ADS] [CrossRef] [Google Scholar]
- Peirani, S., & Pacheco, J. A. D. F. 2008, A&A, 488, 845 [NASA ADS] [CrossRef] [EDP Sciences] [Google Scholar]
- Peñarrubia, J., Ma, Y.-Z., Walker, M. G., & McConnachie, A. 2014, MNRAS, 443, 2204 [Google Scholar]
- Perlmutter, S., Aldering, G., Goldhaber, G., et al. 1999, ApJ, 517, 565 [Google Scholar]
- Planck Collaboration VI. 2020, A&A, 641, A6 [Erratum: A&A 652, C4 (2021)] [NASA ADS] [CrossRef] [EDP Sciences] [Google Scholar]
- Sandage, A. 1986, ApJ, 307, 1 [NASA ADS] [CrossRef] [Google Scholar]
- Tanoglidis, D., Pavlidou, V., & Tomaras, T. 2015, JCAP, 12, 060 [CrossRef] [Google Scholar]
- Teerikorpi, P., & Chernin, A. D. 2010, A&A, 516, A93 [NASA ADS] [CrossRef] [EDP Sciences] [Google Scholar]
- Tully, R. B. 2015a, AJ, 149, 54 [NASA ADS] [CrossRef] [Google Scholar]
- Tully, R. B. 2015b, AJ, 149, 171 [NASA ADS] [CrossRef] [Google Scholar]
- Tully, R. B., Rizzi, L., Shaya, E. J., et al. 2009, AJ, 138, 323 [NASA ADS] [CrossRef] [Google Scholar]
- Tully, R. B., Kourkchi, E., Courtois, H. M., et al. 2023, ApJ, 944, 94 [NASA ADS] [CrossRef] [Google Scholar]
- Wagner, J., & Benisty, D. 2025, A&A, 698, A211 [NASA ADS] [CrossRef] [EDP Sciences] [Google Scholar]
- Wagner, J., Benisty, D., & Karachentsev, I. D. 2025, A&A, in press, https://doi.org/10.1051/0004-6361/202557876 [Google Scholar]
All Tables
All Figures
|
Fig. 1. Spatial distribution of galaxies in CenA – M83 group shown in rotated Cartesian coordinates centred on the midpoint between Cen A and M83. Symbols are colour-coded by heliocentric radial velocity (km s−1). Dashed grey circles indicate the individual virial regions of Cen A and M83, and the black circle marks the 1.5 Mpc zero-velocity surface. |
| In the text | |
|
Fig. 2. Schematic illustration of barycentre (c) determination along the line connecting the CenA and M83 galaxies. For a given dwarf galaxy (g), the radial velocity is estimated using either the minor- or major-infall model. The barycentre is identified by minimising the velocity dispersion of the radial velocities towards the barycentre. θ is the angle between galaxy (g) and the centre (c). |
| In the text | |
|
Fig. 3. Root mean square of the relative velocity dispersion, |
| In the text | |
|
Fig. 4. Radial-velocity versus 3D distance from the group barycentre for the minor (left) and the major (right) infall models. The Muse galaxies are shown in green, and the galaxies used for the fit are shown in black. The Hubble-flow-fit model is presented with a 3σ error. |
| In the text | |
|
Fig. 5. Posterior distributions for Hubble constant, H0; the group mass, M [1012 ⊙ ]; and intrinsic velocity dispersion, δI [km/s]. The blue contour shows the minor-infall model, while the red one shows major-infall posterior. |
| In the text | |
|
Fig. 6. Dependence of fitted Hubble constant (H0) and group mass (Mgroup) on the choice of minimum and maximum selection radii. The blue curves correspond to the minor-infall model, and the red curves correspond to the major-infall model. The coloured area corresponds to the 1σ uncertainty on the results. Top panels: Fitted values of H0. Bottom panels: Fitted values of Mgroup. Left: Variation of H0 and Mgroup as function of minimum radius, rminimum, used on selected galaxies for the fit. In these cases, the maximum radius was fixed at 6 Mpc, and galaxies close to the CoM and apparently infalling towards it were kept. Right: Variation of H0 and Mgroup as function of maximum radius, rmaximum. Here, the minimum radius was fixed at 1.4 Mpc, and nearby galaxies infalling towards the CoM were kept. |
| In the text | |
|
Fig. 7. Comparison of CenA/M83 galaxy-group mass estimates obtained in this work with other recent estimates taken from Peirani & Pacheco (2008), Karachentsev et al. (2007), Müller et al. (2019, 2025), Karachentsev & Kashibadze (2021), Del Popolo et al. (2021). An overall estimate with (6.53 ± 1.66)×1012 M⊙ is added as a grey zone. |
| In the text | |
Current usage metrics show cumulative count of Article Views (full-text article views including HTML views, PDF and ePub downloads, according to the available data) and Abstracts Views on Vision4Press platform.
Data correspond to usage on the plateform after 2015. The current usage metrics is available 48-96 hours after online publication and is updated daily on week days.
Initial download of the metrics may take a while.