Fig. 3.
Download original image
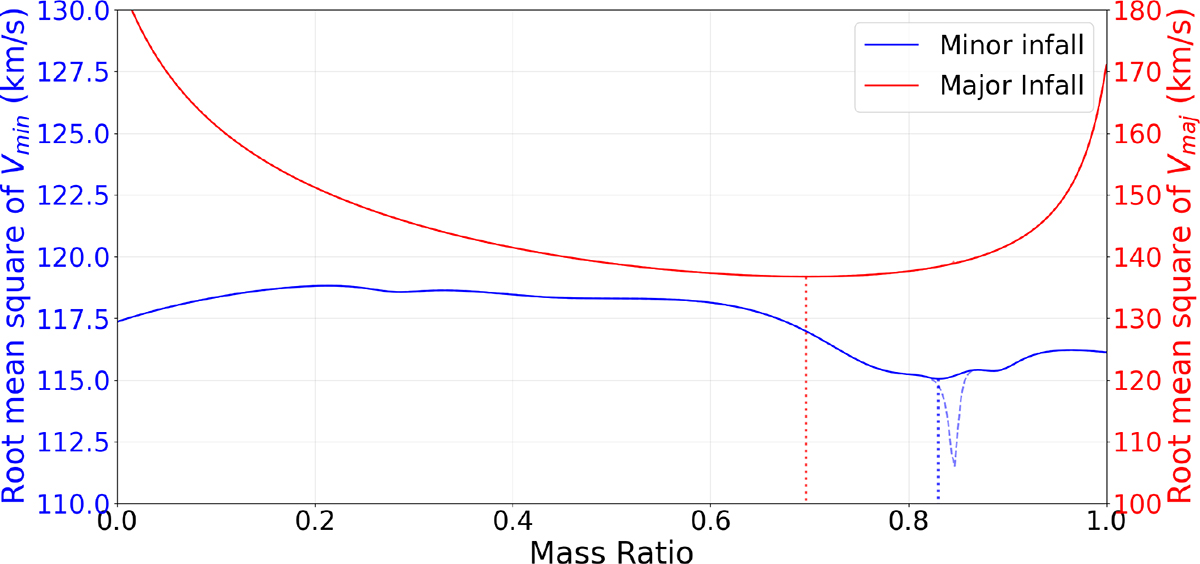
Root mean square of the relative velocity dispersion, ![]() , with respect to the CenA/M83 system’s barycentre, shown as a function of the mass ratio
, with respect to the CenA/M83 system’s barycentre, shown as a function of the mass ratio ![]() . Velocities are measured in the Local Group frame under the minor-infall (blue) and major-infall (red) models. Dotted lines: Raw results of
. Velocities are measured in the Local Group frame under the minor-infall (blue) and major-infall (red) models. Dotted lines: Raw results of ![]() as a function of
as a function of ![]() , mostly lying slightly below the smoothed (solid) curves, except for a local spike near
, mostly lying slightly below the smoothed (solid) curves, except for a local spike near ![]() in the minor infall case. This spike is interpreted as a numerical bias arising from the clustering of galaxies near the CenA/M83 barycentre position (Müller et al. 2021, 2025). The vertical dashed lines show positions of the minima in
in the minor infall case. This spike is interpreted as a numerical bias arising from the clustering of galaxies near the CenA/M83 barycentre position (Müller et al. 2021, 2025). The vertical dashed lines show positions of the minima in ![]() for each model, indicating the best-fitting mass ratio. To avoid confusion, these vertical lines are plotted with a distinct dashed style, different from the dotted raw data lines.
for each model, indicating the best-fitting mass ratio. To avoid confusion, these vertical lines are plotted with a distinct dashed style, different from the dotted raw data lines.
Current usage metrics show cumulative count of Article Views (full-text article views including HTML views, PDF and ePub downloads, according to the available data) and Abstracts Views on Vision4Press platform.
Data correspond to usage on the plateform after 2015. The current usage metrics is available 48-96 hours after online publication and is updated daily on week days.
Initial download of the metrics may take a while.