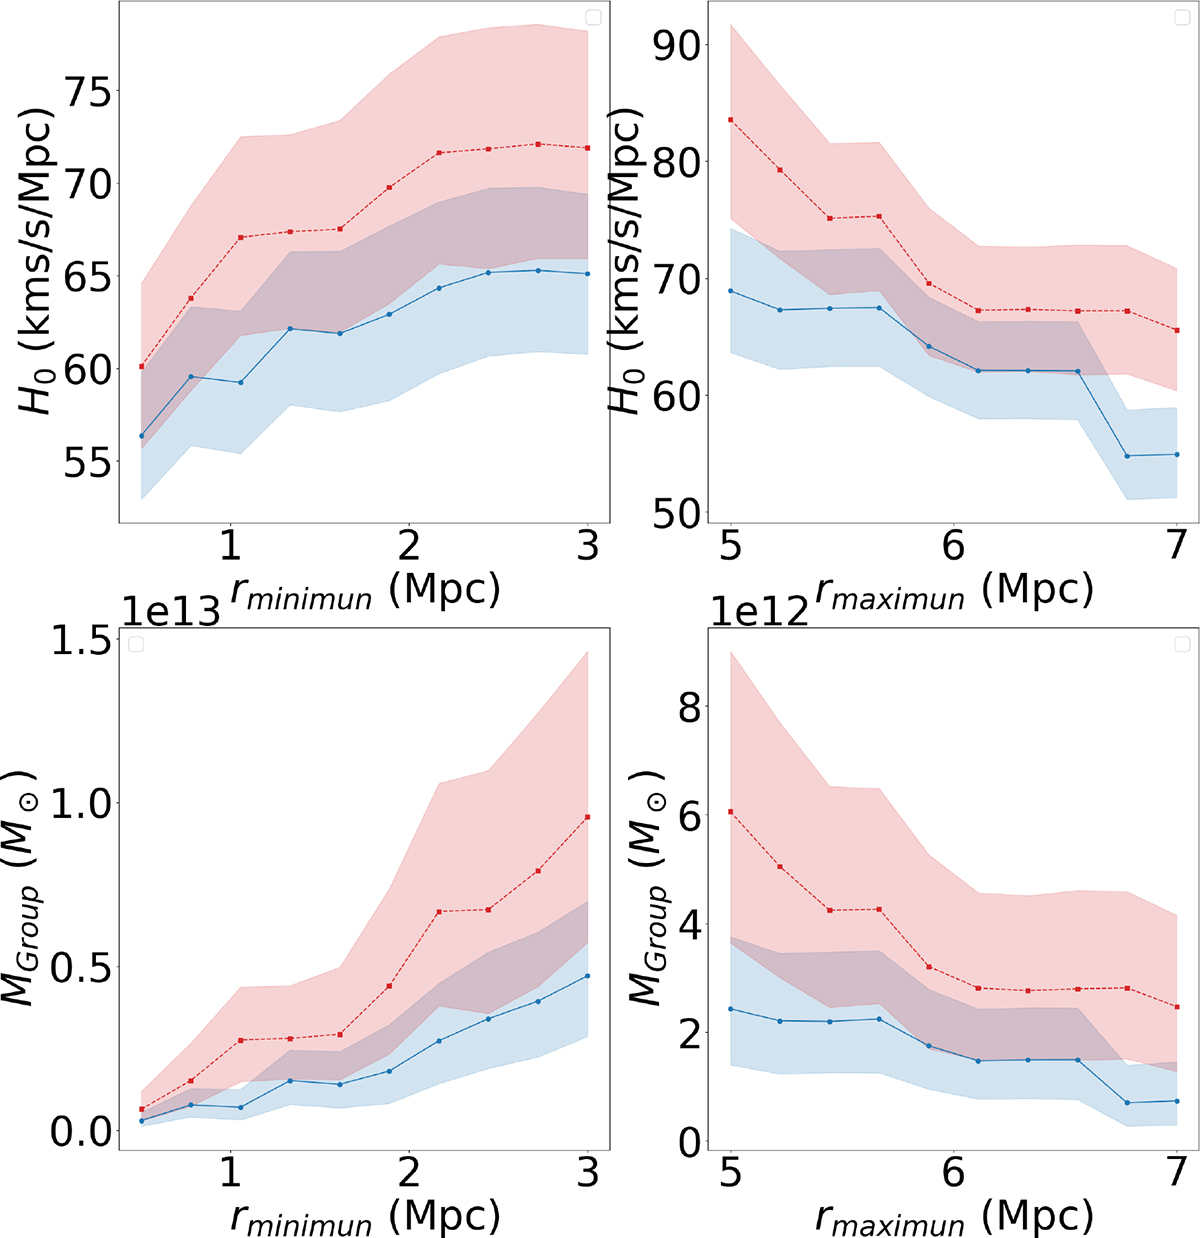
Fig. 6.
Download original image
Dependence of fitted Hubble constant (H0) and group mass (Mgroup) on the choice of minimum and maximum selection radii. The blue curves correspond to the minor-infall model, and the red curves correspond to the major-infall model. The coloured area corresponds to the 1σ uncertainty on the results. Top panels: Fitted values of H0. Bottom panels: Fitted values of Mgroup. Left: Variation of H0 and Mgroup as function of minimum radius, rminimum, used on selected galaxies for the fit. In these cases, the maximum radius was fixed at 6 Mpc, and galaxies close to the CoM and apparently infalling towards it were kept. Right: Variation of H0 and Mgroup as function of maximum radius, rmaximum. Here, the minimum radius was fixed at 1.4 Mpc, and nearby galaxies infalling towards the CoM were kept.
Current usage metrics show cumulative count of Article Views (full-text article views including HTML views, PDF and ePub downloads, according to the available data) and Abstracts Views on Vision4Press platform.
Data correspond to usage on the plateform after 2015. The current usage metrics is available 48-96 hours after online publication and is updated daily on week days.
Initial download of the metrics may take a while.