Fig. 1.
Download original image
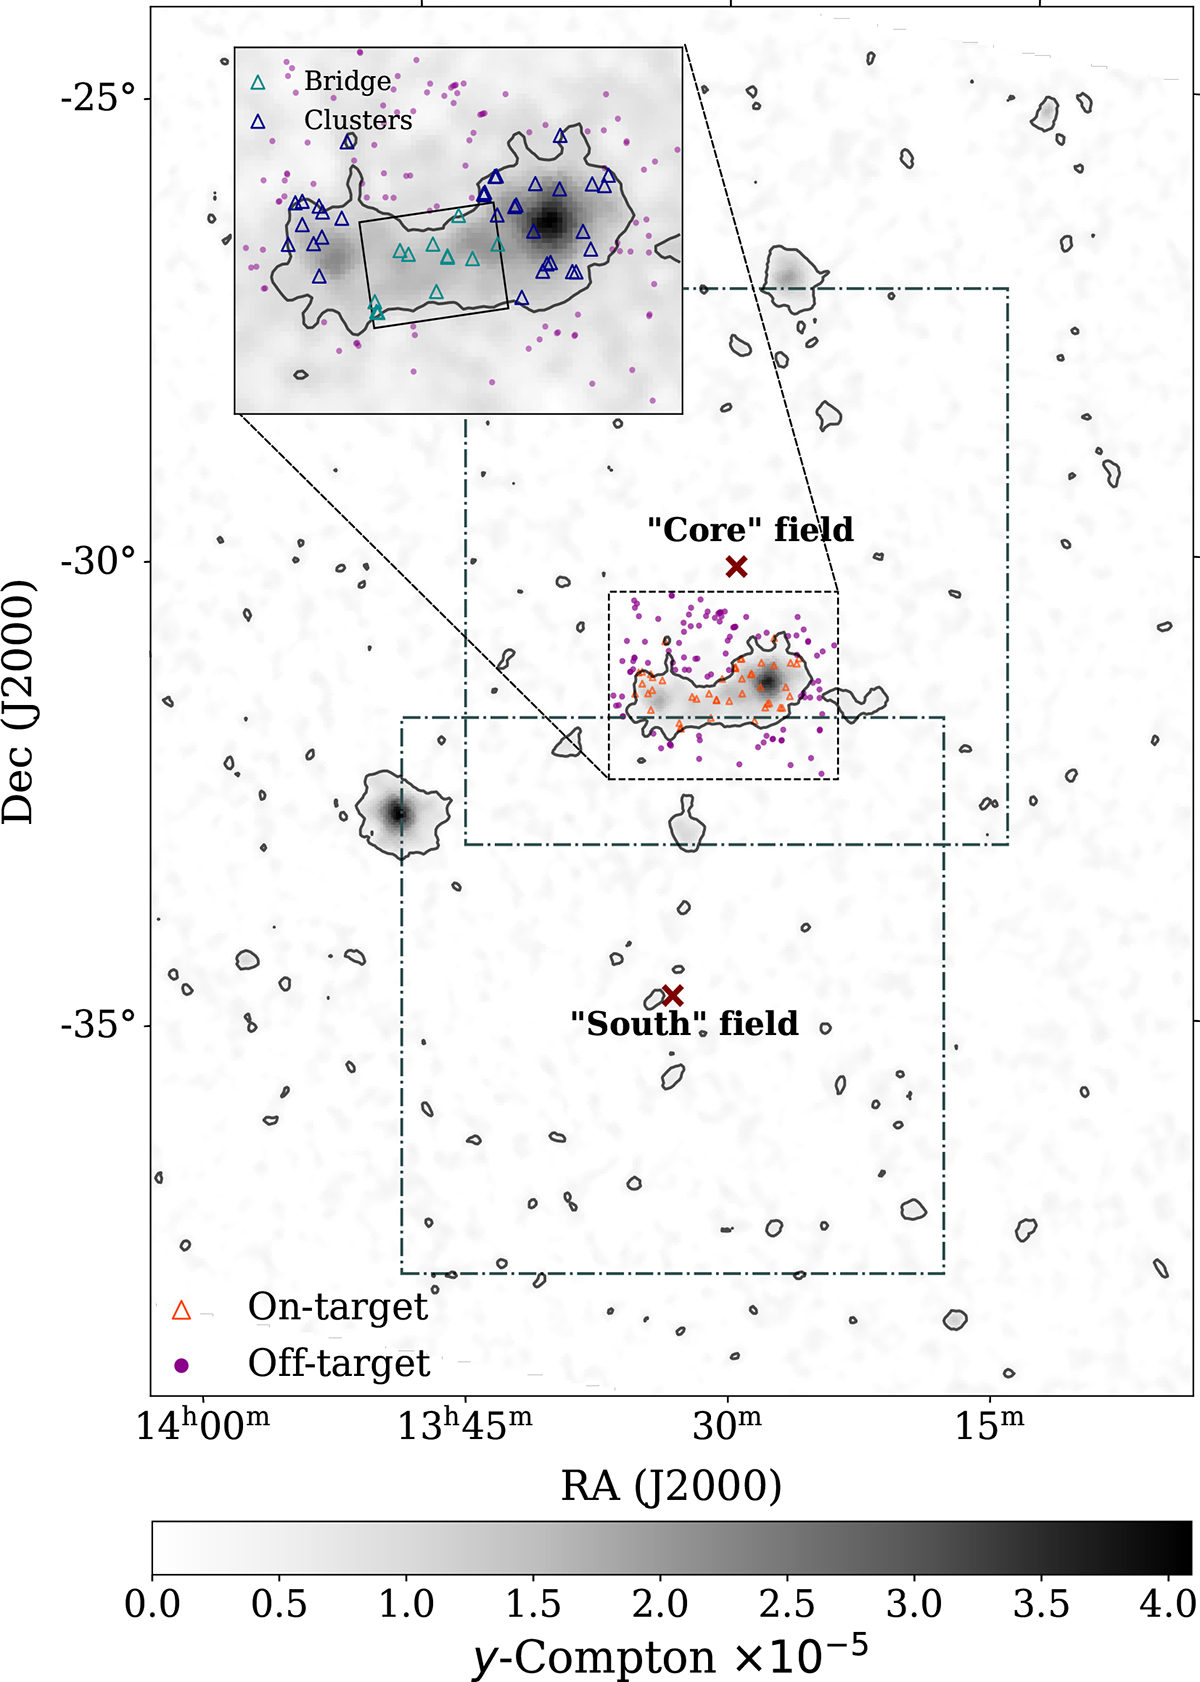
POSSUM RMs used in this work and the definition of the different RM subsamples. The background shows the Planck tSZ effect y map. The dash-dotted squares represent the (6 deg)2 Band 1 ASKAP fields, namely, the “core” and “south” fields, with their centers represented by red crosses. The black contour represents the ybdry = 4.24 × 10⁻⁶ value used to define the on-target (orange triangles) and off-target (purple dots) samples. These two are inside the 1.71 × 2.42 deg2 (5.8 × 8.2 Mpc2) y-map cutout used for the analysis (see Sect. 2.2). The zoomed-in region at the top left corner of the plot shows the bridge (cyan triangles) and cluster (blue triangles) subsamples, all of which belong in the on-target region. The bridge box used to define the bridge sources is also represented to ease the interpretation of the plot.
Current usage metrics show cumulative count of Article Views (full-text article views including HTML views, PDF and ePub downloads, according to the available data) and Abstracts Views on Vision4Press platform.
Data correspond to usage on the plateform after 2015. The current usage metrics is available 48-96 hours after online publication and is updated daily on week days.
Initial download of the metrics may take a while.