Fig. 10.
Download original image
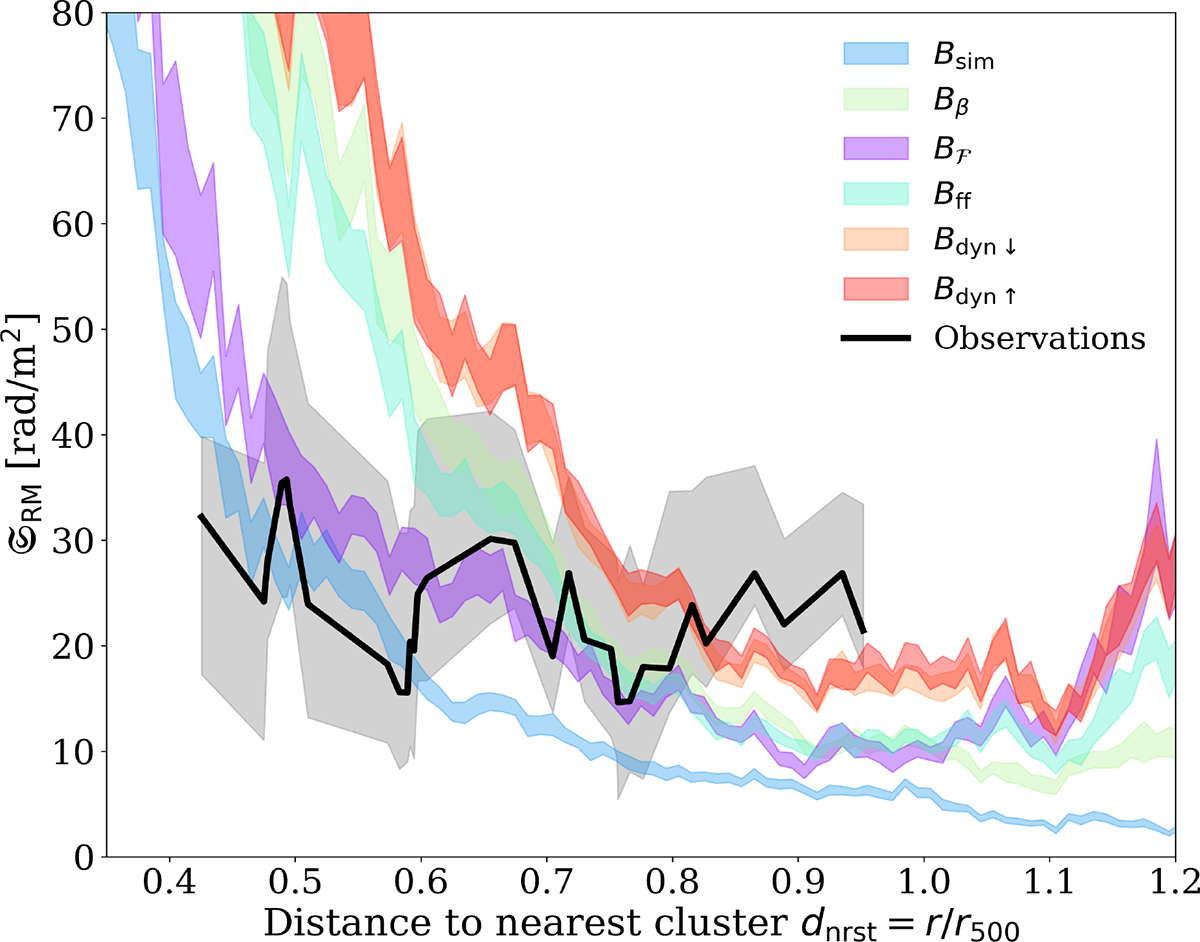
Rotation measure scatter profiles (𝔖RM) with distance to the nearest cluster only. The black line represents the observed scatter profile, which was computed using a fixed sliding window of N = 16 points. The gray shaded region represents its 68% confidence intervals obtained with bootstrapping resampling. The observational dnrst values have been rescaled by a factor of ×0.8 to account for the difference in projected distance between the SLOW analog clusters and the real A3558-A3562. The colored regions are the SLOW 68% C.L. error regions (made with a sliding window of fixed size 0.01 r500) for the RM maps that correspond to all amplification mechanisms of the magnetic field in the intercluster region.
Current usage metrics show cumulative count of Article Views (full-text article views including HTML views, PDF and ePub downloads, according to the available data) and Abstracts Views on Vision4Press platform.
Data correspond to usage on the plateform after 2015. The current usage metrics is available 48-96 hours after online publication and is updated daily on week days.
Initial download of the metrics may take a while.