Open Access
Fig. A.1.
Download original image
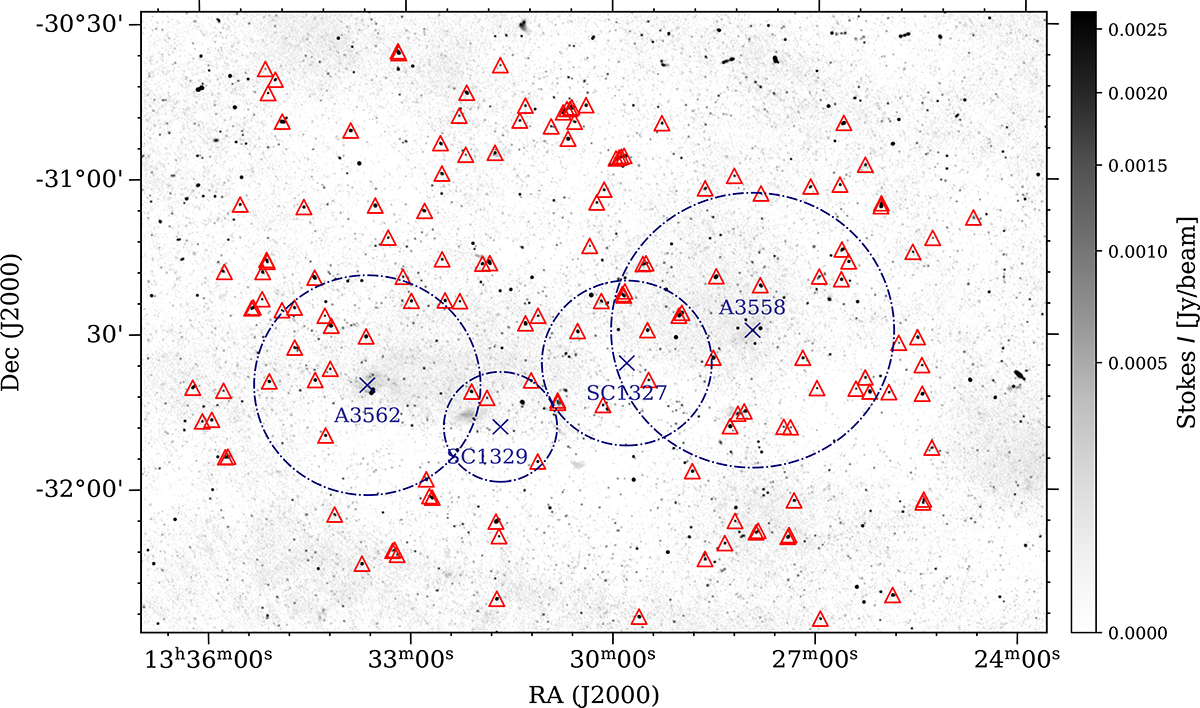
Stokes I image of the ASKAP fields with the location of the 149 final RMs in the catalog and the centers of the clusters and groups of the Shapley Supercluster core relevant for this work. The circles represent their r500 = 1.5, 1.2, 0.9, 0.6 Mpc. The colorbar is in units of Jy/beam.
Current usage metrics show cumulative count of Article Views (full-text article views including HTML views, PDF and ePub downloads, according to the available data) and Abstracts Views on Vision4Press platform.
Data correspond to usage on the plateform after 2015. The current usage metrics is available 48-96 hours after online publication and is updated daily on week days.
Initial download of the metrics may take a while.