Fig. 2.
Download original image
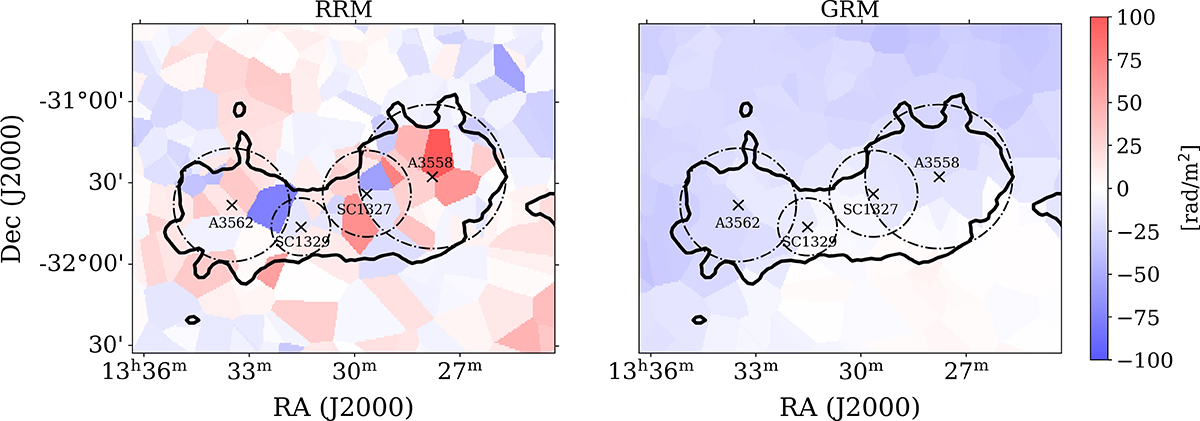
RRM and GRM maps made by interpolation to the nearest pixel of the estimated value at the particular position of a source from our catalog with the annulus method. The black contour corresponds to ybdry = 4.24 × 10⁻⁶ (same as in Fig. 1; see Sect. 3.3). The centers of the clusters and groups are represented by black crosses, while the dash-dotted circles represent their r500. Left: Residual rotation measure map. The random nature of the patches in the map with similar sizes between them indicates that we have removed the larger coherent RM structure of the foreground Galactic contribution, while retaining the information about the SSC. Right: GRM map. Contrary to the behavior of the patches in the RRM map, this map exhibits a large continuous gradient in the RMs, which is expected for the large-scale Galactic contribution.
Current usage metrics show cumulative count of Article Views (full-text article views including HTML views, PDF and ePub downloads, according to the available data) and Abstracts Views on Vision4Press platform.
Data correspond to usage on the plateform after 2015. The current usage metrics is available 48-96 hours after online publication and is updated daily on week days.
Initial download of the metrics may take a while.