Fig. 4.
Download original image
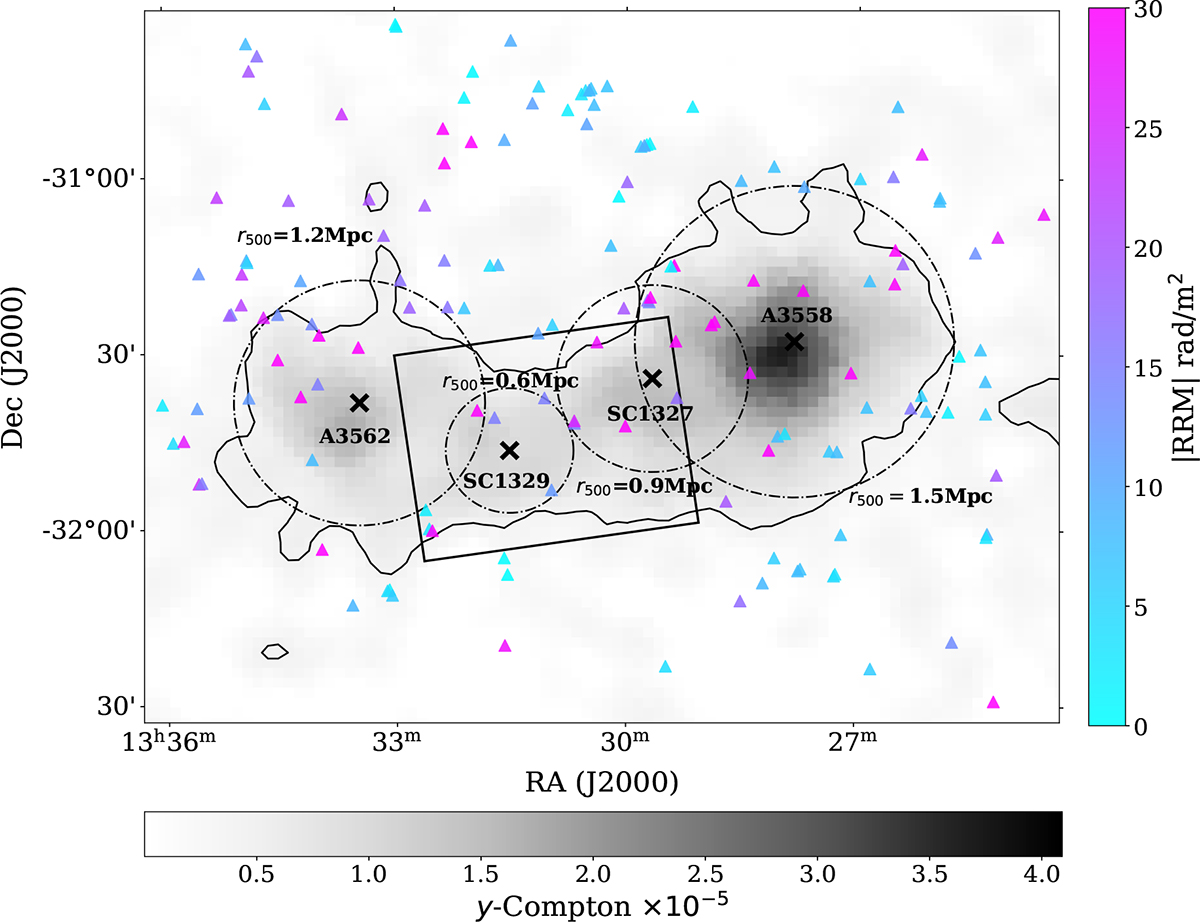
tSZ Planck map of the A3558-A3562 clusters system as well as the two massive groups of galaxies SC 1327 and SC1329. The triangles represent the locations of the background ASKAP radiogalaxies and they are colored according to their |RRM| values. We also show the r500 of the four objects as reference for the size of the system at the plane of the sky, along with their centers. The black contour represents the threshold we used to define the boundary between the off-target and on-target regions: ybdry = 2yrms = 4.24 × 10⁻⁶. The rectangular box defines the bridge. The sources inside it sample the region between the Abell clusters and outside their r500, despite some overlapping effects. The counterpart on-target sources that lie outside the box mainly sample the inside the of r500 of the clusters, thus its name: the clusters subsample.
Current usage metrics show cumulative count of Article Views (full-text article views including HTML views, PDF and ePub downloads, according to the available data) and Abstracts Views on Vision4Press platform.
Data correspond to usage on the plateform after 2015. The current usage metrics is available 48-96 hours after online publication and is updated daily on week days.
Initial download of the metrics may take a while.