Fig. 5.
Download original image
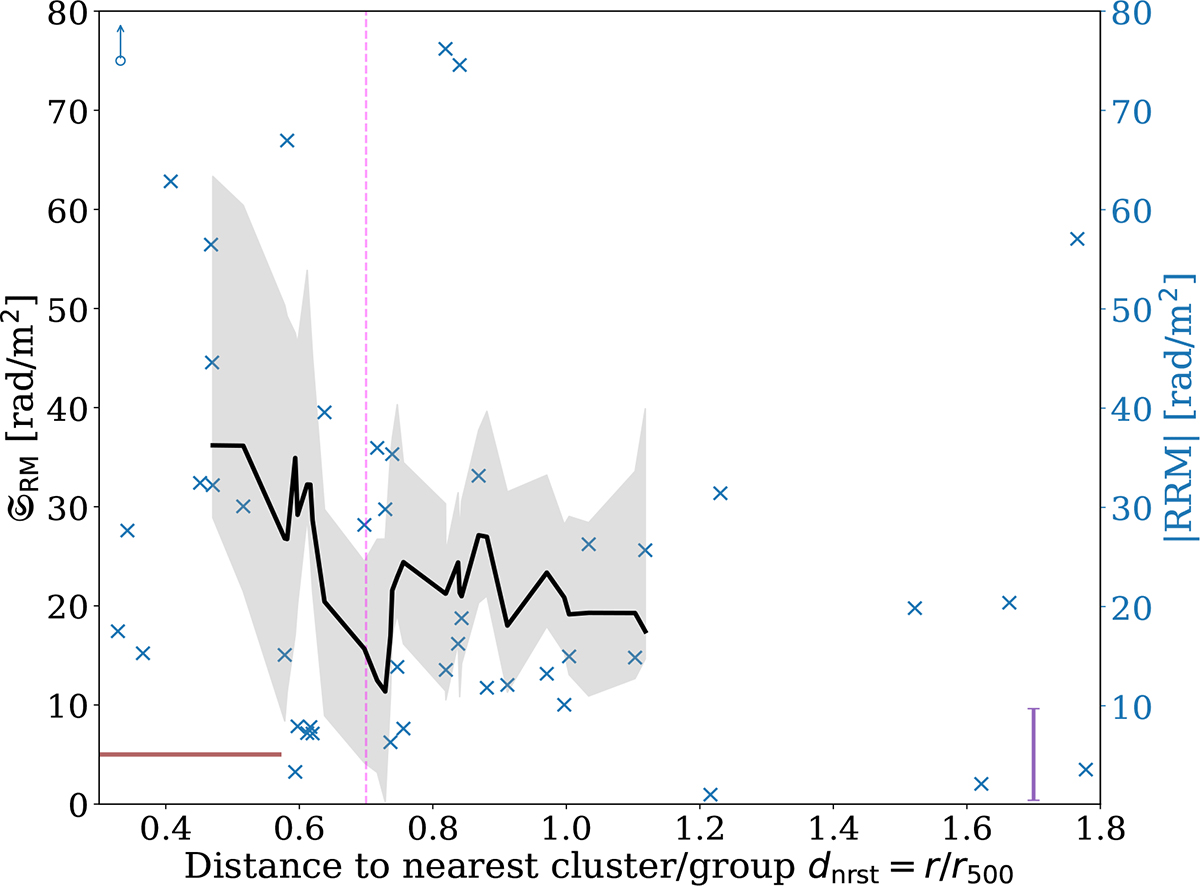
Observed 𝔖RM(dnrst) profile (black line). The gray shaded region is the 68% C.L. error region. The blue crosses represent the amplitude of the RRMs of the on-target region, while the horizontal line is σoff − target. The arrow-shaped data point corresponds to an outlier value of ∼230 rad/m2. The vertical line is set at 0.7 r500, which is the scale at which overlapping effects start to take place. The horizontal segment at the lower left corner represents the median window size of ∼0.3 r500. The vertical purple error bar (lower right corner) indicates the median on-target δRRM = 4.6 rad/m2.
Current usage metrics show cumulative count of Article Views (full-text article views including HTML views, PDF and ePub downloads, according to the available data) and Abstracts Views on Vision4Press platform.
Data correspond to usage on the plateform after 2015. The current usage metrics is available 48-96 hours after online publication and is updated daily on week days.
Initial download of the metrics may take a while.