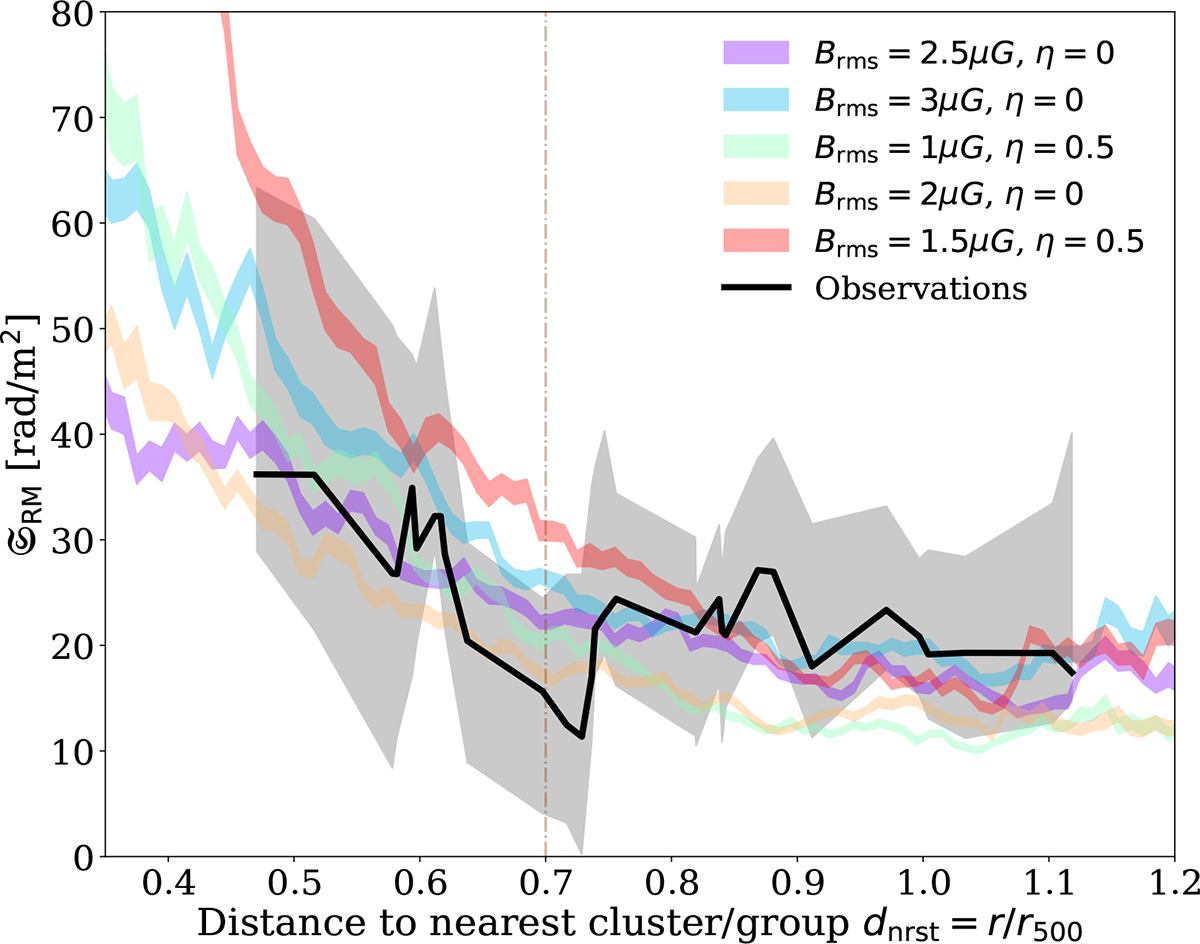
Fig. 7.
Download original image
Rotation measure scatter profiles (𝔖RM). The color-shaded regions represent the 68% C.L. error regions for the MiRò profiles (made with a sliding window of fixed size 0.01 r500). We show the five MiRò models with highest Bayesian evidence. The black line represents the observed scatter profile and the gray shaded region represents its 68% C.L. error region. The vertical line is at 0.7 r500, where overlapping structures start to dominate.
Current usage metrics show cumulative count of Article Views (full-text article views including HTML views, PDF and ePub downloads, according to the available data) and Abstracts Views on Vision4Press platform.
Data correspond to usage on the plateform after 2015. The current usage metrics is available 48-96 hours after online publication and is updated daily on week days.
Initial download of the metrics may take a while.