Open Access
Fig. 8.
Download original image
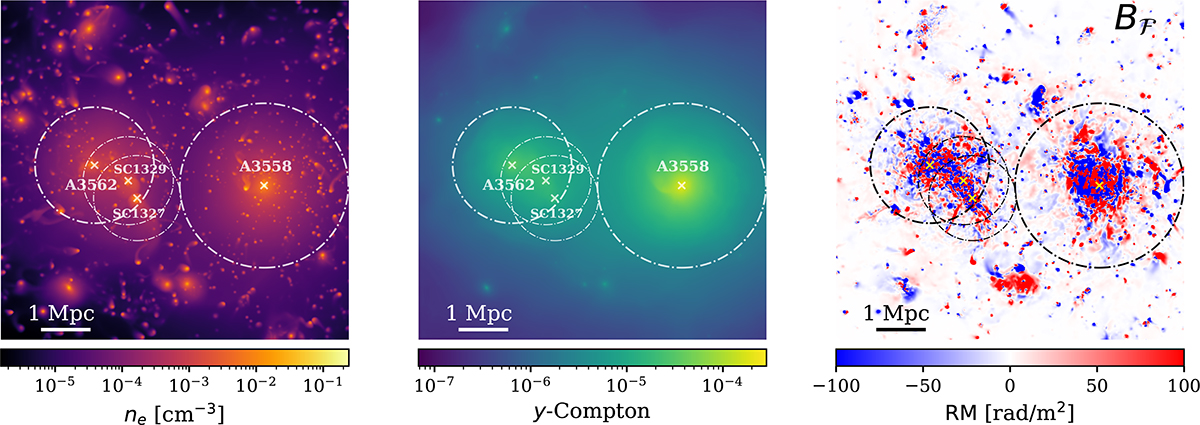
Zoom-in simulation of the Shapley analog found in the SLOW simulation. From left to right: electron number density, y-Compton parameter, RM map for the dynamo ↓ amplification mechanism. We show the r500 of the two clusters and the two groups, namely: 1.7, 1.2, 0.91, and 0.88 Mpc in decreasing order of mass.
Current usage metrics show cumulative count of Article Views (full-text article views including HTML views, PDF and ePub downloads, according to the available data) and Abstracts Views on Vision4Press platform.
Data correspond to usage on the plateform after 2015. The current usage metrics is available 48-96 hours after online publication and is updated daily on week days.
Initial download of the metrics may take a while.