Fig. 9.
Download original image
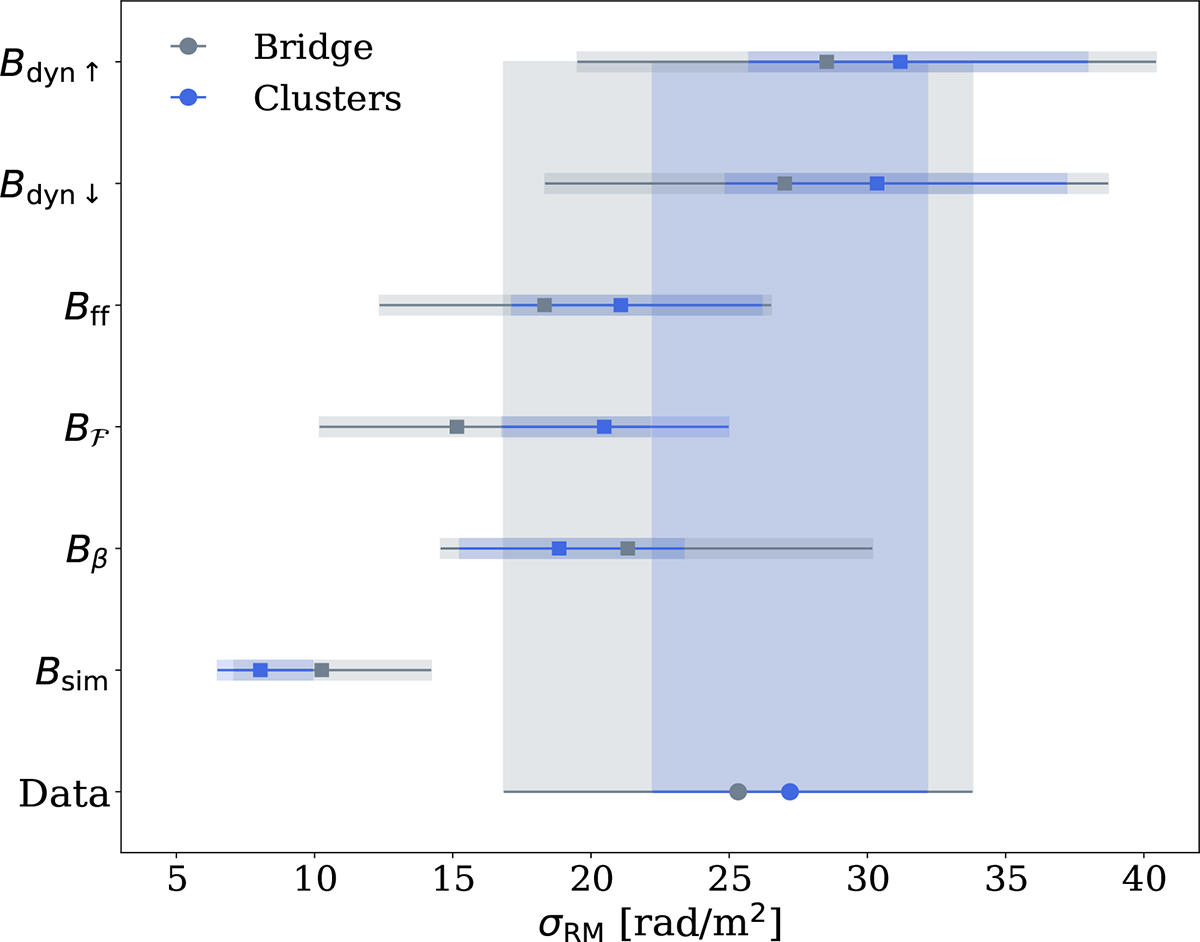
Visual comparison of the excess RM scatter in the bridge and clusters regions between the observations (bottom line) and all magnetic field amplification mechanisms implemented in SLOW. Horizontally, we represent the 68% C.L. error region for each model. Vertically we outline the statistical error estimated for the observations for visual comparison reasons.
Current usage metrics show cumulative count of Article Views (full-text article views including HTML views, PDF and ePub downloads, according to the available data) and Abstracts Views on Vision4Press platform.
Data correspond to usage on the plateform after 2015. The current usage metrics is available 48-96 hours after online publication and is updated daily on week days.
Initial download of the metrics may take a while.