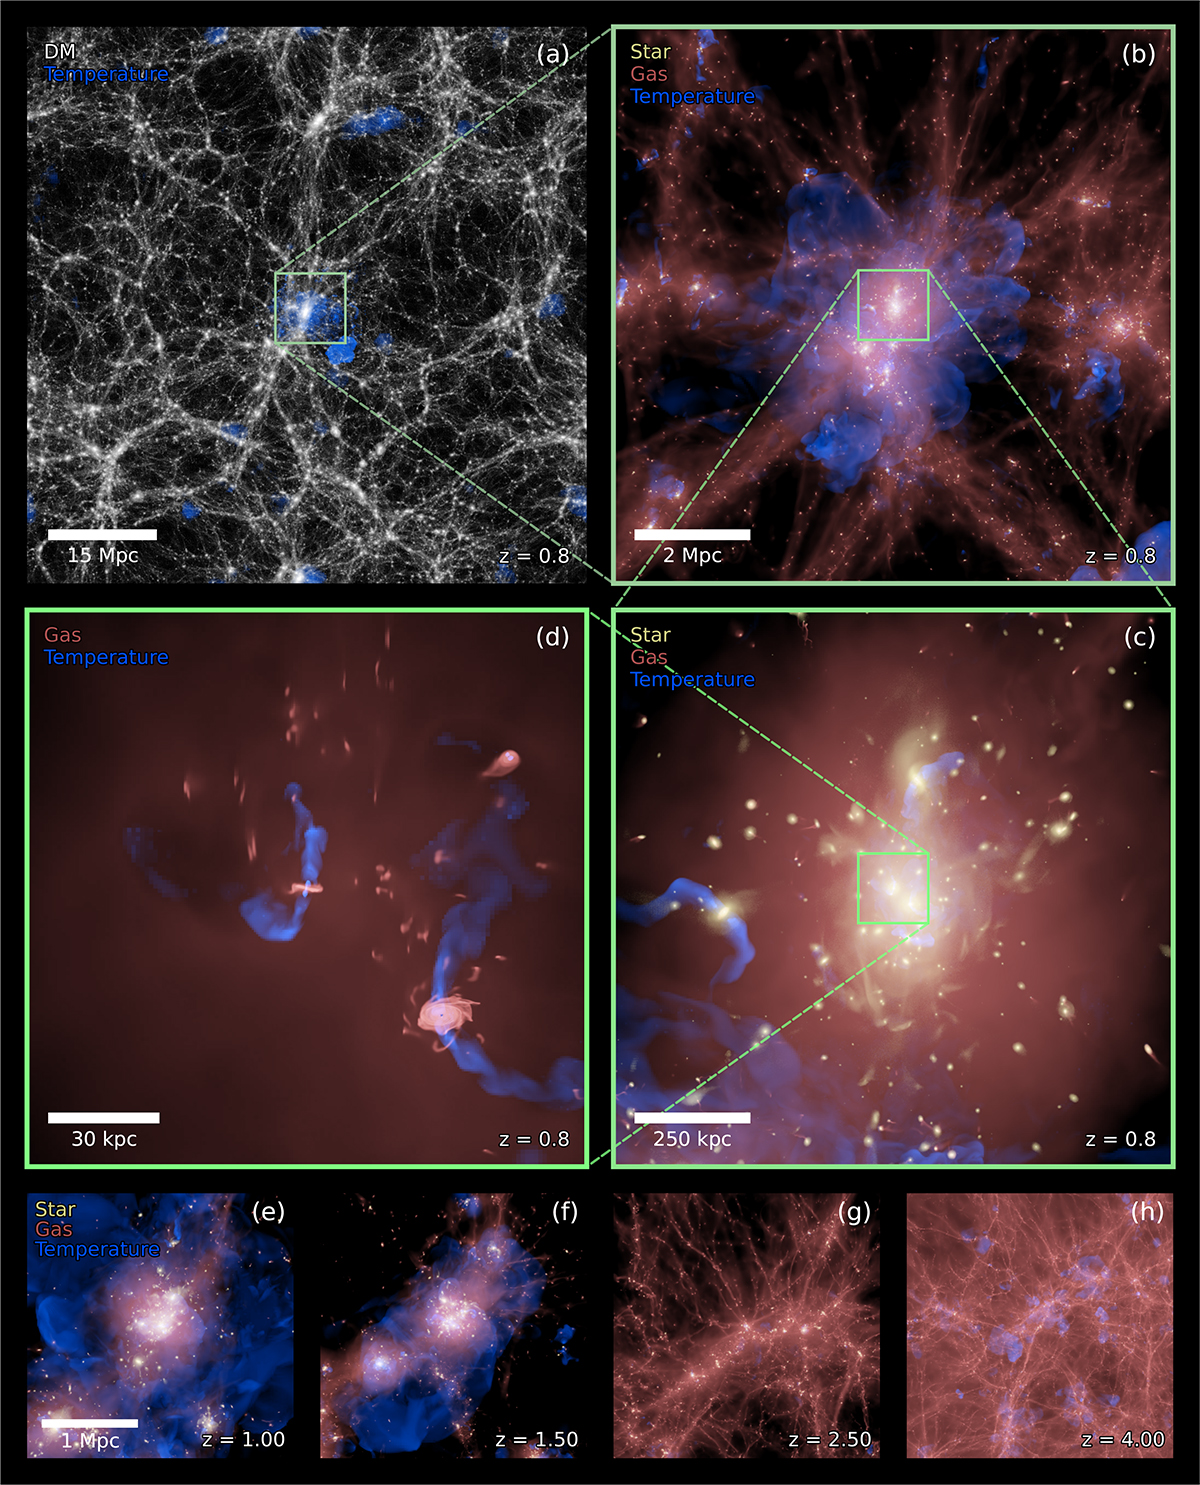
Fig. 1.
Download original image
Overview of the NEWCLUSTER simulation. The figure shows images of (a) the large-scale volume that includes a low-resolution region, (b) the zoom-in region that includes clusters and local gas filaments, (c) the main cluster and infalling galaxies, and (d) the central brightest cluster galaxy with a relatively massive companion on the lower right side. Each panel shows a different combination of components that are specified on the upper left side with their corresponding colors. The extent of zoom-in panels (b), (c), and (d) is indicated by thin green boxes in larger panels (a), (b), and (c), respectively. Panels (e), (f), (g), and (h) show the region around the same target halo at different redshifts, z = 1.0, 1.5, 2.5, and 4.0. The scale bar indicates physical lengths in all panels.
Current usage metrics show cumulative count of Article Views (full-text article views including HTML views, PDF and ePub downloads, according to the available data) and Abstracts Views on Vision4Press platform.
Data correspond to usage on the plateform after 2015. The current usage metrics is available 48-96 hours after online publication and is updated daily on week days.
Initial download of the metrics may take a while.