Fig. 10.
Download original image
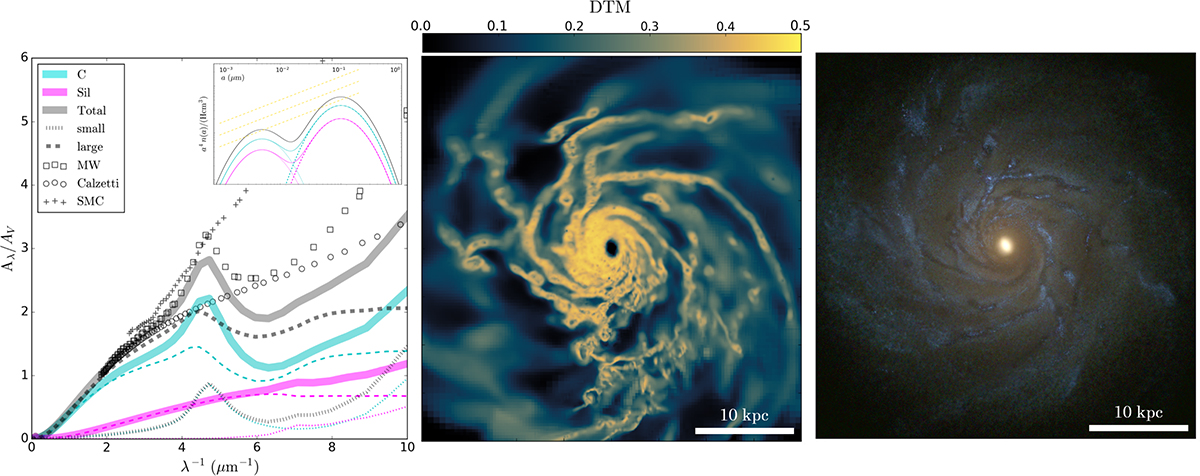
Example galaxy extinction curve and corresponding mock observation. The extinction curve is shown in the first column of the figure. The total extinction curve (grey) is presented along with the contributions from graphite (cyan) and silicate (magenta) grains, each shown with two different size distributions (dotted lines for small grains and dashed lines for large grains). The MW (Fitzpatrick & Massa 2007) extinction, SMC (Pei 1992) extinction, and Calzetti attenuation curves are also included for comparison. The grain size distributions for different grain types are shown in the sub-panel, with the MRN (Mathis et al. 1977) slope indicated by a yellow dashed line. The spatial distribution of the DTM is shown in the second column. The corresponding mock image, created using SDSS g, r, and i bands for RGB, is shown in the last column.
Current usage metrics show cumulative count of Article Views (full-text article views including HTML views, PDF and ePub downloads, according to the available data) and Abstracts Views on Vision4Press platform.
Data correspond to usage on the plateform after 2015. The current usage metrics is available 48-96 hours after online publication and is updated daily on week days.
Initial download of the metrics may take a while.