Fig. 11.
Download original image
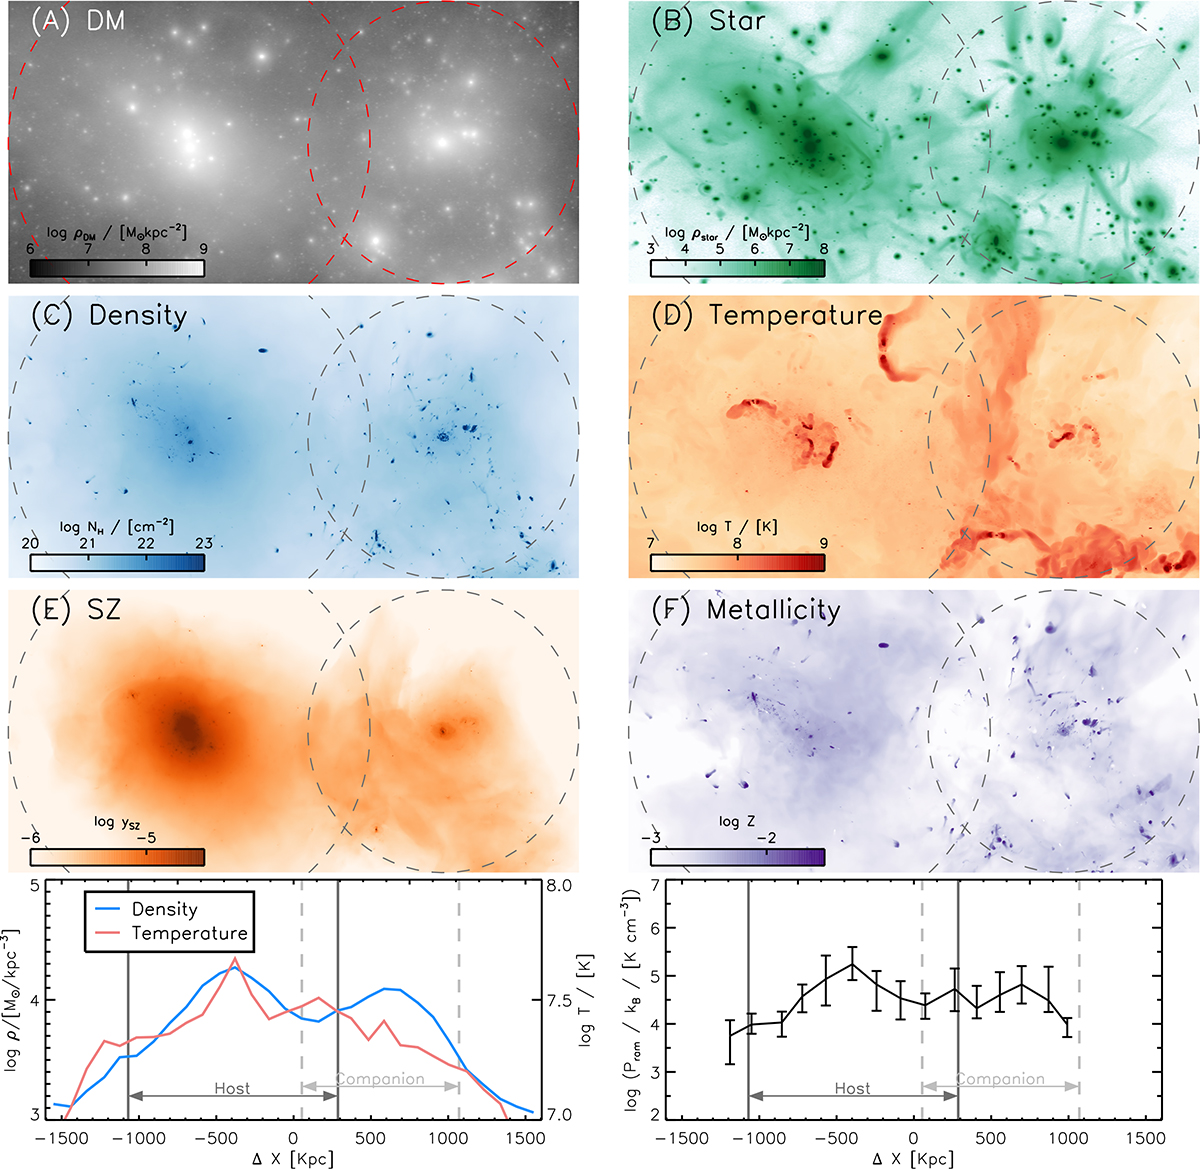
Multicomponent view of the merging clusters at z = 0.73 with different components (six upper panels) and 1D profiles of the merging clusters (bottom two panels). From (A) to (E), DM surface density, stellar surface density, gas column density, temperature, the Sunyaev-Zeldovich signal by the y-parameter, and metallicity are shown, in which virial radii of the clusters are drawn with dashed circles. The compression of ICM caused by the major merger can be seen by a high contrast of y-parameter at the merger front. The bottom-left panel shows the 1D profiles of density (blue solid line) and temperature (red solid line) along the collision axis. The locations of the virial radii are shown with the vertical lines. The bottom-right panels display the median ram pressure profiles of galaxies along the collision axis. Galaxies at the merger boundary (0 kpc ≲ ΔX ≲ 300 kpc) undergo higher external pressure compared to those on the far side of the merger front.
Current usage metrics show cumulative count of Article Views (full-text article views including HTML views, PDF and ePub downloads, according to the available data) and Abstracts Views on Vision4Press platform.
Data correspond to usage on the plateform after 2015. The current usage metrics is available 48-96 hours after online publication and is updated daily on week days.
Initial download of the metrics may take a while.