Open Access
Fig. 4.
Download original image
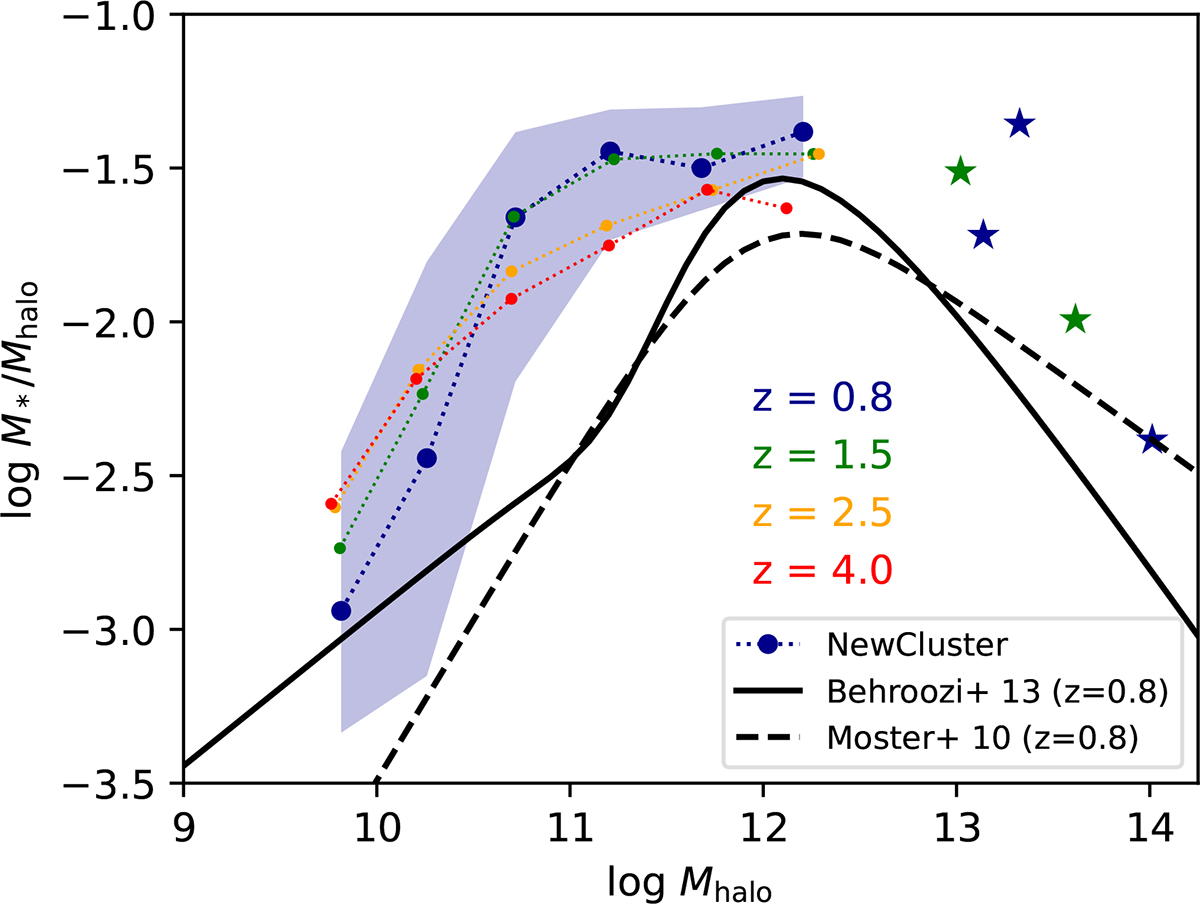
Stellar-to-halo mass ratio as a function of halo mass for all central galaxies. Circles show median values in each bin, color-coded with different redshifts. Shade indicates 1σ scatter of the distribution at z = 0.8. Stars indicate individual galaxies. Empirical relations at z = 0.8 are shown as black lines.
Current usage metrics show cumulative count of Article Views (full-text article views including HTML views, PDF and ePub downloads, according to the available data) and Abstracts Views on Vision4Press platform.
Data correspond to usage on the plateform after 2015. The current usage metrics is available 48-96 hours after online publication and is updated daily on week days.
Initial download of the metrics may take a while.