Fig. 5.
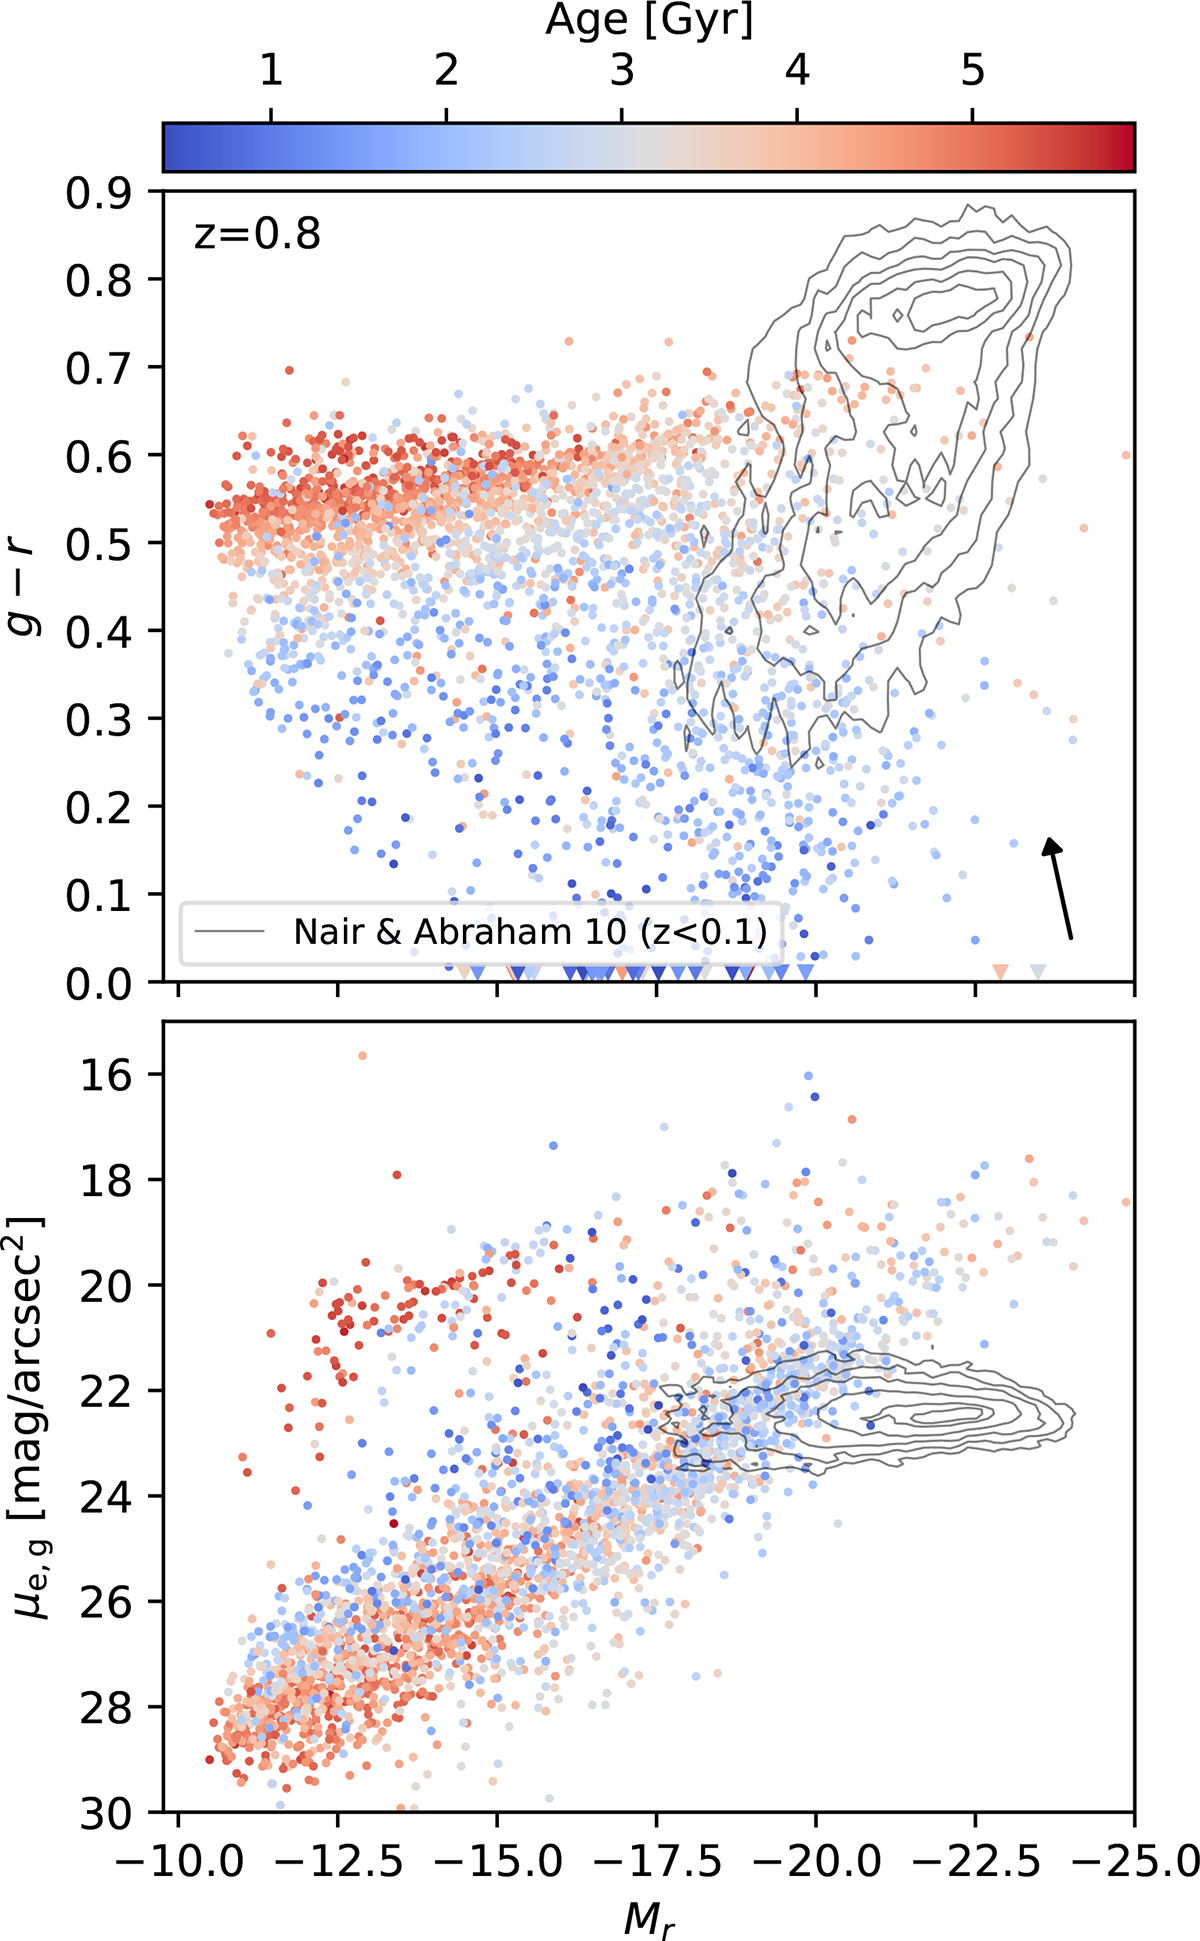
Download original image
Photometric properties of NEWCLUSTER galaxies at z = 0.8. The x-axis shows the r-band absolute magnitude. The y-axis of the top (bottom) panel represents g − r color (g-band effective surface brightness). We also present the black arrow to show the effect of dust attenuation assuming E(B − V) = 0.1 with Calzetti attenuation curve (Calzetti et al. 2000). The color of data points indicates the mass-weighted age of galaxies. The grey contours in both panels represent local observations from SDSS (Nair & Abraham 2010).
Current usage metrics show cumulative count of Article Views (full-text article views including HTML views, PDF and ePub downloads, according to the available data) and Abstracts Views on Vision4Press platform.
Data correspond to usage on the plateform after 2015. The current usage metrics is available 48-96 hours after online publication and is updated daily on week days.
Initial download of the metrics may take a while.